class ReportsController < ApplicationController
  def monthly_sales
    year = params.fetch(:year, Date.current.year).to_i
    rows = Order.monthly_sales(year: year)
    @report = MonthlySalesReport.new(rows, year: year)

    respond_to do |format|
      format.html
      format.json do
        render json: {
          year: year,
          total_revenue: @report.total_revenue,
          lines: @report.lines
        }
      end
    end
  end
end
class Order < ApplicationRecord
  scope :completed, -> { where(status: :completed) }

  MonthlyRow = Struct.new(:month, :revenue_cents, :order_count, :avg_cents, keyword_init: true)

  def self.monthly_sales(year:)
    range = Date.new(year, 1, 1).beginning_of_day..Date.new(year, 12, 31).end_of_day

    rows = completed
      .where(created_at: range)
      .unscope(:order)
      .group(Arel.sql("date_trunc('month', created_at)"))
      .order(Arel.sql("date_trunc('month', created_at)"))
      .pluck(
        Arel.sql("date_trunc('month', created_at)"),
        Arel.sql("SUM(total_cents)"),
        Arel.sql("COUNT(*)"),
        Arel.sql("ROUND(AVG(total_cents))")
      )

    rows.map do |month, revenue, count, avg|
      MonthlyRow.new(
        month: month.to_date,
        revenue_cents: revenue.to_i,
        order_count: count.to_i,
        avg_cents: avg.to_i
      )
    end
  end
end
class MonthlySalesReport
  def initialize(rows, year:)
    @rows = rows.index_by(&:month)
    @year = year
  end

  def lines
    previous = nil
    (1..12).map do |m|
      row = @rows[Date.new(@year, m, 1)]
      revenue = row&.revenue_cents.to_i
      line = {
        month: Date::MONTHNAMES[m],
        revenue: format_money(revenue),
        orders: row&.order_count.to_i,
        avg_order: format_money(row&.avg_cents.to_i),
        growth: growth_pct(previous, revenue)
      }
      previous = revenue
      line
    end
  end

  def total_revenue
    format_money(@rows.values.sum(&:revenue_cents))
  end

  private

  def growth_pct(prev, current)
    return nil if prev.nil? || prev.zero?
    ((current - prev) * 100.0 / prev).round(1)
  end

  def format_money(cents)
    format('$%.2f', cents / 100.0)
  end
end
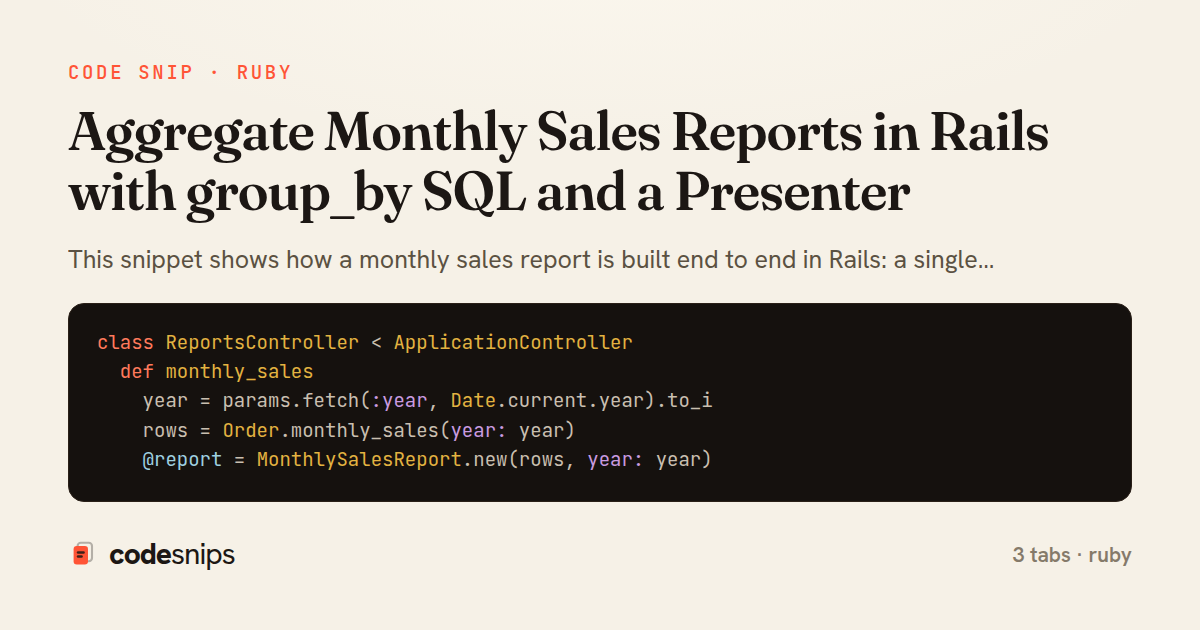
This snippet shows how a monthly sales report is built end to end in Rails: a single grouped aggregate query, a plain Ruby presenter that shapes the raw numbers for a view, and the controller that wires them together. The goal is to push the heavy lifting into the database and keep Ruby responsible only for presentation, which is the split that keeps reporting endpoints fast and readable.
In Order model, the class method monthly_sales is the core of the report. It uses date_trunc('month', ...) in a group clause so Postgres collapses every order into one row per calendar month, and it computes SUM, COUNT, and AVG in the same pass. The query returns a hash keyed by the truncated timestamp because group(...).sum(...) alone can only carry one aggregate; instead the code selects an explicit column list and calls unscope(:order) so no default scope leaks a stray ORDER BY into the grouped query. Filtering happens with a completed scope and a bounded date range, so the index on (status, created_at) can be used and partial months at the edges are excluded predictably.
Each result row is a lightweight Struct (MonthlyRow) rather than a full record, which avoids instantiating thousands of Order objects just to read three numbers — a common performance pitfall when aggregation is done in Ruby with group_by on a loaded collection.
In MonthlySalesReport presenter, the raw rows are decorated for display. It fills gaps so months with zero sales still appear, formats currency and percentages, and derives growth_pct by comparing each month to the previous one. Keeping this logic out of the model means the same query can feed a CSV export or a chart without duplicating formatting rules, and the presenter stays trivial to unit test because it takes plain data in and returns plain data out.
In ReportsController, the action parses the requested year, delegates the query to Order.monthly_sales, wraps the result in the presenter, and responds with either HTML or JSON. The controller holds no business logic — it only coordinates. This layering (query in the model, formatting in the presenter, coordination in the controller) is the pattern to reach for whenever a report grows beyond a one-off sum, because it isolates the parts that change for different reasons.
Related snips
class CommentsController < ApplicationController
  before_action :set_post

  def create
    @comment = @post.comments.build(comment_params)
System test: asserting Turbo Stream responses
class Post < ApplicationRecord
  belongs_to :author, class_name: 'User'
  has_many :comments, dependent: :destroy

  scope :published, -> { where.not(published_at: nil).where('published_at <= ?', Time.current) }
  scope :draft, -> { where(published_at: nil) }
ActiveRecord scopes for reusable query logic
module Api
  module V1
    class UsersController < BaseController
      def show
        user = User.includes(:profile).find(params[:id])
ETags for conditional requests and caching
class PostsController < ApplicationController
  def index
    @posts = Post.includes(:author)
                 .order(created_at: :desc)
                 .page(params[:page])
                 .per(10)
Turbo Frames: infinite scroll with lazy-loading frame
package dbutil

import (
  "context"

  "github.com/jackc/pgconn"
Retry Postgres serialization failures with bounded attempts
require "csv"

class PeopleCsvStream
  include Enumerable

  HEADERS = %w[id full_name email signed_up_at plan].freeze
Resilient CSV Export as a Streamed Response
Share this code
Here's the card — post it anywhere.