import { Registry, Histogram, Counter, collectDefaultMetrics } from 'prom-client';

export const register = new Registry();

collectDefaultMetrics({ register });

export const httpRequestDuration = new Histogram({
  name: 'http_request_duration_seconds',
  help: 'Duration of HTTP requests in seconds',
  labelNames: ['method', 'route', 'status_code'] as const,
  buckets: [0.005, 0.01, 0.025, 0.05, 0.1, 0.25, 0.5, 1, 2.5, 5],
  registers: [register],
});

export const httpRequestsTotal = new Counter({
  name: 'http_requests_total',
  help: 'Total number of HTTP requests',
  labelNames: ['method', 'route', 'status_code'] as const,
  registers: [register],
});
import { Request, Response, NextFunction } from 'express';
import { httpRequestDuration, httpRequestsTotal } from './metrics';

export function latencyMiddleware(req: Request, res: Response, next: NextFunction): void {
  const endTimer = httpRequestDuration.startTimer();

  res.on('finish', () => {
    const route = req.route?.path ?? 'unknown';
    const labels = {
      method: req.method,
      route,
      status_code: String(res.statusCode),
    };

    endTimer(labels);
    httpRequestsTotal.inc(labels);
  });

  next();
}
import express, { Request, Response } from 'express';
import { latencyMiddleware } from './latencyMiddleware';
import { register } from './metrics';

const app = express();

app.use(latencyMiddleware);

app.get('/users/:id', async (req: Request, res: Response) => {
  const user = await lookupUser(req.params.id);
  res.json(user);
});

app.get('/metrics', async (_req: Request, res: Response) => {
  res.set('Content-Type', register.contentType);
  res.end(await register.metrics());
});

app.listen(3000, () => {
  console.log('listening on :3000, metrics at /metrics');
});

async function lookupUser(id: string): Promise<{ id: string }> {
  return { id };
}
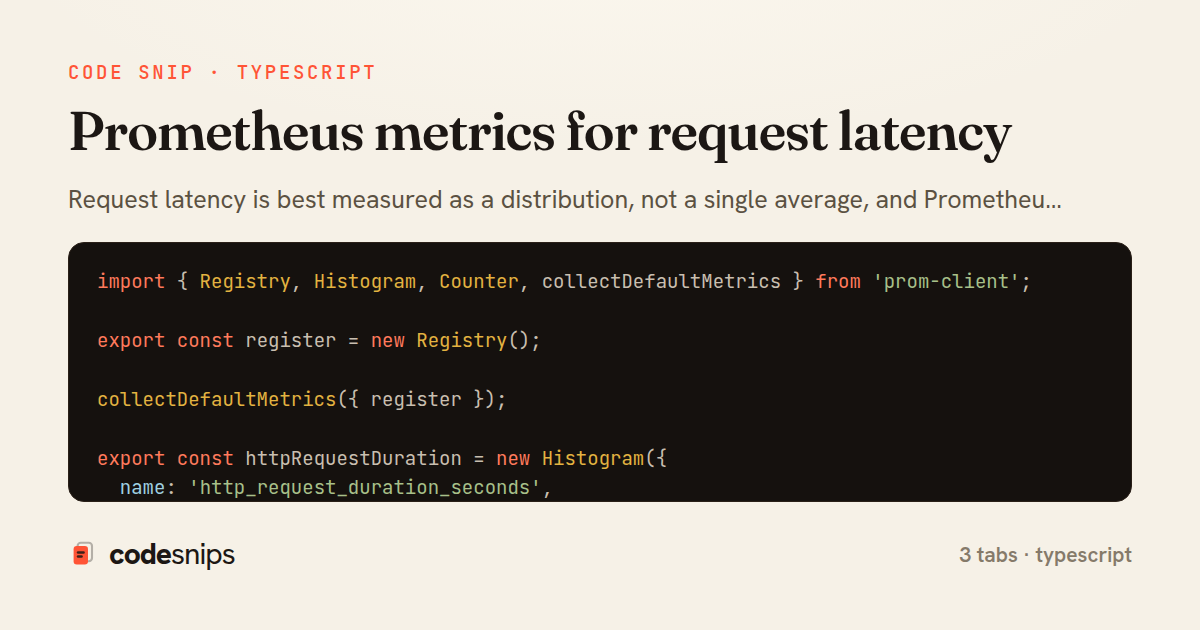
Request latency is best measured as a distribution, not a single average, and Prometheus histograms are the standard tool for this. This snippet wires a prom-client histogram into an Express app so every HTTP request contributes an observation, and exposes the accumulated buckets on a /metrics endpoint that a Prometheus server can scrape.
In metrics.ts, a single shared Registry holds all metrics. Calling collectDefaultMetrics adds process-level gauges (event loop lag, heap usage, GC) that come free with the client. The core object is httpRequestDuration, a Histogram whose labelNames are method, route, and status_code. The explicit buckets array is the most important design decision: a histogram counts how many observations fall at or below each boundary, so the buckets must span the expected latency range. Here they run from 5ms to 5s on a roughly exponential scale, which gives fine resolution for fast requests while still capturing slow outliers. Poorly chosen buckets are the classic pitfall — too coarse and percentile estimates become meaningless, too many and cardinality explodes.
The module also exposes httpRequestsTotal, a monotonically increasing Counter, because counters and histograms answer different questions: rate of traffic versus shape of latency.
In latencyMiddleware.ts, the middleware calls httpRequestDuration.startTimer(...) to capture a monotonic start time. Timing is finalized on the response finish event rather than inline, so it measures until the last byte is flushed. Labels are resolved lazily inside the finish handler because req.route is only populated after routing. The key detail is req.route?.path ?? 'unknown': labelling by the route pattern (/users/:id) rather than the raw URL keeps cardinality bounded — using raw paths would create a new time series per unique id and eventually overwhelm Prometheus.
In server.ts, latencyMiddleware is registered before the routes so it wraps every handler, and /metrics responds with register.contentType and the text exposition format that Prometheus expects. Placing the metrics route last, unlabelled by the timer, avoids self-instrumentation noise. Together these files form the minimal, production-shaped pattern for turning raw request timings into queryable histogram_quantile percentiles in Grafana.
Related snips
package api

import (
  "net/http"
  "runtime/debug"
)
Expose build metadata for debugging deploys
use tracing::{info, instrument};

#[instrument]
fn process_request(user_id: u64) {
    info!(user_id, "Processing request");
    // Work happens here
tracing for structured logging and distributed tracing
export type Settled<R> =
  | { status: 'fulfilled'; value: R }
  | { status: 'rejected'; reason: unknown };

export interface ConcurrencyOptions {
  limit: number;
Simple concurrency limiter for batch operations
import { randomBytes, createHash } from "crypto";
import jwt from "jsonwebtoken";
import { RefreshTokenStore } from "./store";

const ACCESS_SECRET = process.env.ACCESS_SECRET!;
const ACCESS_TTL = "15m";
JWT access + refresh token rotation (conceptual)
import pandas as pd
from sklearn.ensemble import IsolationForest

df = pd.read_csv('service_metrics.csv')
features = df[['latency_p95', 'error_rate', 'throughput', 'cpu_utilization']]
Anomaly detection with isolation forest and robust thresholds
# Grafana provisioning: datasources
# /etc/grafana/provisioning/datasources/prometheus.yml
apiVersion: 1
datasources:
  - name: Prometheus
    type: prometheus
Grafana dashboards as code with JSON provisioning
Share this code
Here's the card — post it anywhere.