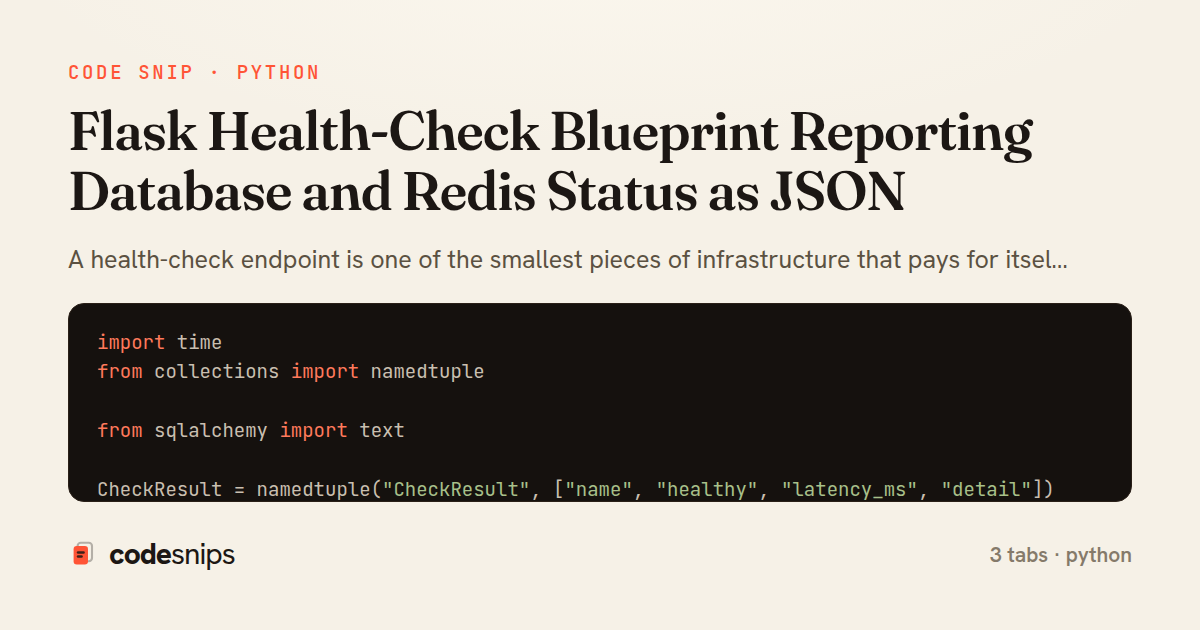
import time
from collections import namedtuple

from sqlalchemy import text

CheckResult = namedtuple("CheckResult", ["name", "healthy", "latency_ms", "detail"])


def _timed(name, probe):
    start = time.perf_counter()
    try:
        detail = probe()
        healthy = True
    except Exception as exc:  # a probe must never propagate
        detail = str(exc)
        healthy = False
    latency_ms = round((time.perf_counter() - start) * 1000, 2)
    return CheckResult(name=name, healthy=healthy, latency_ms=latency_ms, detail=detail)


def check_database(engine):
    def probe():
        with engine.connect() as conn:
            conn.execute(text("SELECT 1"))
        return "connection ok"

    return _timed("database", probe)


def check_redis(redis_client):
    def probe():
        if not redis_client.ping():
            raise RuntimeError("PING returned falsy")
        return "ping ok"

    return _timed("redis", probe)
from flask import Blueprint, current_app, jsonify

from .checks import check_database, check_redis

health_bp = Blueprint("health", __name__)


def init_health(app, engine, redis_client):
    app.config["HEALTH_DEPS"] = {"engine": engine, "redis": redis_client}
    app.register_blueprint(health_bp, url_prefix="/health")


def _run_all():
    deps = current_app.config["HEALTH_DEPS"]
    return [
        check_database(deps["engine"]),
        check_redis(deps["redis"]),
    ]


@health_bp.route("/live")
def live():
    return jsonify(status="ok"), 200


@health_bp.route("/ready")
def ready():
    results = _run_all()
    all_healthy = all(r.healthy for r in results)
    payload = {
        "status": "ok" if all_healthy else "degraded",
        "checks": {
            r.name: {
                "healthy": r.healthy,
                "latency_ms": r.latency_ms,
                "detail": r.detail,
            }
            for r in results
        },
    }
    return jsonify(payload), 200 if all_healthy else 503
import os

import redis
from flask import Flask
from sqlalchemy import create_engine

from .health import init_health


def create_app():
    app = Flask(__name__)

    engine = create_engine(
        os.environ["DATABASE_URL"],
        pool_pre_ping=True,
        pool_recycle=1800,
    )

    redis_client = redis.Redis.from_url(
        os.environ["REDIS_URL"],
        socket_timeout=1.0,
        socket_connect_timeout=1.0,
    )

    init_health(app, engine=engine, redis_client=redis_client)
    return app


app = create_app()
A health-check endpoint is one of the smallest pieces of infrastructure that pays for itself repeatedly: load balancers, orchestrators like Kubernetes, and uptime monitors all poll it to decide whether an instance should receive traffic. This snippet builds that endpoint as a self-contained Flask blueprint that probes each critical dependency and reports the results as machine-readable JSON, distinguishing between liveness (is the process running?) and readiness (can it actually serve requests?).
The checks module isolates the actual probing logic from the web layer. Each check is a small function returning a CheckResult namedtuple with a name, boolean status, latency, and optional detail. check_database runs a trivial SELECT 1 through SQLAlchemy's engine so it exercises the real connection pool rather than trusting stale state, and check_redis issues a PING. Both wrap their work in _timed, which measures duration and converts any exception into a failed result with the error string — a probe must never raise, or the health endpoint itself becomes the outage.
The health blueprint wires these into three routes. /health/live is deliberately cheap: it returns 200 as long as the process can respond, which is what a liveness probe wants, since restarting a pod because Redis blipped would be counterproductive. /health/ready runs every registered check and aggregates them; if any dependency is down it returns HTTP 503 so orchestrators stop routing traffic while still reporting per-dependency detail in the body. The status code is derived from all(...) over the results, and the jsonify payload includes each check's latency so slow-but-alive dependencies are visible in dashboards.
The app factory shows the idiomatic registration: dependencies (engine, redis_client) are created once and passed into init_health via the app config, keeping the blueprint free of import-time side effects and easy to test with fakes. Registering under /health with url_prefix groups the routes cleanly.
A few trade-offs are worth noting. The readiness check does real I/O on every hit, so aggressive polling intervals can add load; caching results for a second or two is a common refinement. Timeouts matter too — the Redis client is configured with a short socket_timeout so a hung dependency fails fast instead of blocking the worker. This pattern generalizes to any number of backends by appending checks to the list.
Related snips
package api

import (
  "net/http"
  "runtime/debug"
)
Expose build metadata for debugging deploys
use tracing::{info, instrument};

#[instrument]
fn process_request(user_id: u64) {
    info!(user_id, "Processing request");
    // Work happens here
tracing for structured logging and distributed tracing
json.array! @posts do |post|
  json.cache! ['v1', post], expires_in: 1.hour do
    json.id post.id
    json.title post.title
    json.excerpt post.excerpt
    json.published_at post.published_at
Fragment caching for expensive JSON serialization
import { randomBytes, createHash } from "crypto";
import jwt from "jsonwebtoken";
import { RefreshTokenStore } from "./store";

const ACCESS_SECRET = process.env.ACCESS_SECRET!;
const ACCESS_TTL = "15m";
JWT access + refresh token rotation (conceptual)
import pandas as pd
from sklearn.ensemble import IsolationForest

df = pd.read_csv('service_metrics.csv')
features = df[['latency_p95', 'error_rate', 'throughput', 'cpu_utilization']]
Anomaly detection with isolation forest and robust thresholds
# Grafana provisioning: datasources
# /etc/grafana/provisioning/datasources/prometheus.yml
apiVersion: 1
datasources:
  - name: Prometheus
    type: prometheus
Grafana dashboards as code with JSON provisioning
Share this code
Here's the card — post it anywhere.