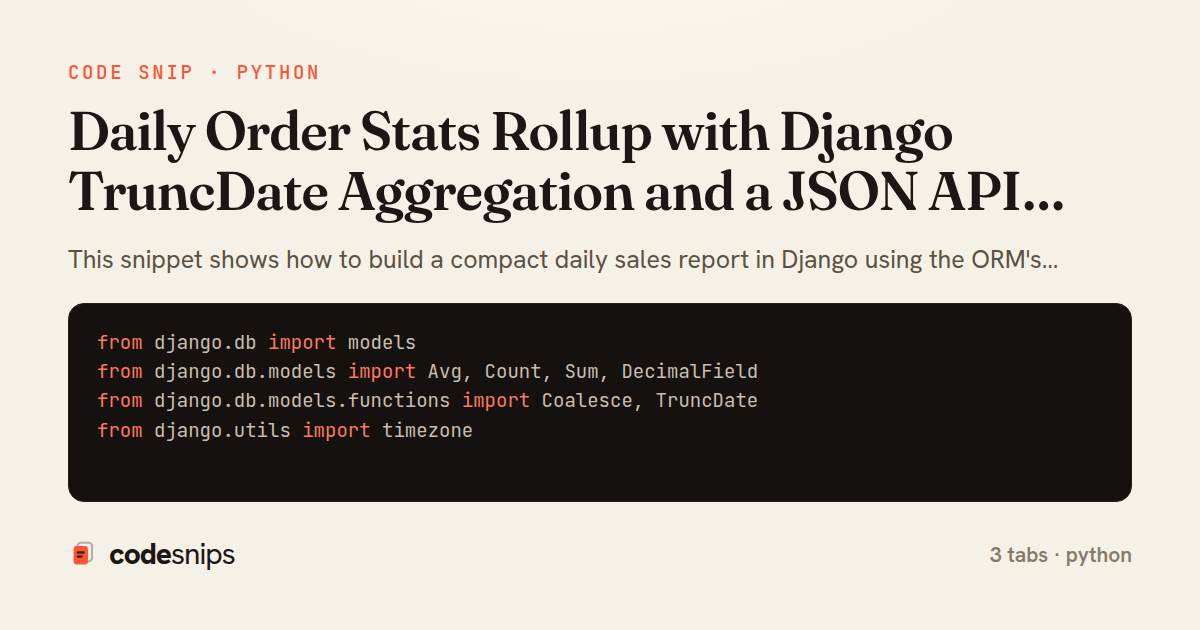
from django.db import models
from django.db.models import Avg, Count, Sum, DecimalField
from django.db.models.functions import Coalesce, TruncDate
from django.utils import timezone


class OrderQuerySet(models.QuerySet):
    def paid(self):
        return self.filter(status=Order.Status.PAID)

    def in_range(self, start, end):
        return self.filter(created_at__date__gte=start, created_at__date__lte=end)

    def daily_stats(self, tz=None):
        tz = tz or timezone.get_current_timezone()
        zero = Coalesce(Sum("total"), 0, output_field=DecimalField())
        return (
            self.paid()
            .annotate(day=TruncDate("created_at", tzinfo=tz))
            .values("day")
            .annotate(
                orders=Count("id"),
                revenue=zero,
                avg_order=Coalesce(Avg("total"), 0, output_field=DecimalField()),
            )
            .order_by("day")
        )


class Order(models.Model):
    class Status(models.TextChoices):
        PENDING = "pending", "Pending"
        PAID = "paid", "Paid"
        REFUNDED = "refunded", "Refunded"

    created_at = models.DateTimeField(default=timezone.now, db_index=True)
    total = models.DecimalField(max_digits=10, decimal_places=2)
    status = models.CharField(max_length=16, choices=Status.choices, default=Status.PENDING)

    objects = OrderQuerySet.as_manager()

    class Meta:
        indexes = [models.Index(fields=["status", "created_at"])]
from datetime import timedelta

from django.http import JsonResponse
from django.utils import timezone
from django.utils.dateparse import parse_date
from django.views import View
from django.views.decorators.cache import cache_page
from django.utils.decorators import method_decorator

from .models import Order


@method_decorator(cache_page(60 * 5), name="dispatch")
class DailyStatsView(View):
    default_days = 30

    def _parse_date(self, raw):
        if not raw:
            return None
        return parse_date(raw)

    def get(self, request):
        today = timezone.localdate()
        start = self._parse_date(request.GET.get("start")) or today - timedelta(days=self.default_days)
        end = self._parse_date(request.GET.get("end")) or today
        if start > end:
            return JsonResponse({"error": "start must be before end"}, status=400)

        rows = Order.objects.in_range(start, end).daily_stats()
        results = [
            {
                "day": row["day"].isoformat(),
                "orders": row["orders"],
                "revenue": str(row["revenue"]),
                "avg_order": str(round(row["avg_order"], 2)),
            }
            for row in rows
        ]
        return JsonResponse(
            {"start": start.isoformat(), "end": end.isoformat(), "results": results}
        )
from django.urls import path

from .views import DailyStatsView

app_name = "reports"

urlpatterns = [
    path("api/stats/daily/", DailyStatsView.as_view(), name="daily-stats"),
]
This snippet shows how to build a compact daily sales report in Django using the ORM's date-truncation and aggregation features, exposed through a lightweight JSON endpoint. The pattern is common in reporting dashboards: instead of pulling every Order row into Python and grouping by hand, the database does the grouping and the arithmetic, returning one row per day.
In models.py, the Order model is intentionally simple — a created_at timestamp, a total decimal, and a status. The OrderQuerySet carries the reporting logic so it can be reused from views, management commands, or the admin. Its paid() method narrows the set to revenue-bearing orders, and daily_stats() is the core rollup: annotate(day=TruncDate('created_at', tzinfo=tz)) collapses each timestamp to a calendar date, .values('day') establishes the GROUP BY, and the trailing .annotate(...) computes Count, Sum, and Avg per group. Coalesce guards against NULL sums on empty days, and ordering by day gives a stable series.
A subtle but important detail is timezone handling. TruncDate truncates in whatever timezone is passed via tzinfo; without it, days would be bucketed in UTC and could disagree with what an operator sees locally. The queryset accepts an explicit tz so the caller controls the boundary, which matters when a sale just before midnight local time must land on the correct day.
In views.py, DailyStatsView reads start and end query parameters, defaults to a trailing window, and calls the queryset method. _parse_date fails soft, returning None for bad input so the view can fall back rather than raising. Results are serialized manually into plain dicts, with Decimal values cast to strings to avoid float rounding surprises in JSON, and the response is cached briefly with cache_page since yesterday's totals rarely change.
urls.py wires the endpoint at /api/stats/daily/. The trade-off of this approach is that the aggregation runs on every uncached request; for high-traffic dashboards one would persist a materialized daily rollup table instead. For moderate volumes, letting TruncDate and annotate push the work into Postgres is fast, correct, and far less code than manual grouping.
Related snips
module Api
  module V1
    class UsersController < BaseController
      def show
        user = User.includes(:profile).find(params[:id])
ETags for conditional requests and caching
class Product(models.Model):
    name = models.CharField(max_length=200)
    slug = models.SlugField(blank=True)
    price = models.DecimalField(max_digits=10, decimal_places=2)
    cost = models.DecimalField(max_digits=10, decimal_places=2)
    margin = models.DecimalField(max_digits=5, decimal_places=2, blank=True)
Django model signals vs overriding save
package dbutil

import (
  "context"

  "github.com/jackc/pgconn"
Retry Postgres serialization failures with bounded attempts
require "csv"

class PeopleCsvStream
  include Enumerable

  HEADERS = %w[id full_name email signed_up_at plan].freeze
Resilient CSV Export as a Streamed Response
from django.urls import path
from . import views

app_name = 'blog'

urlpatterns = [
Django URL namespacing and reverse lookups
json.array! @posts do |post|
  json.cache! ['v1', post], expires_in: 1.hour do
    json.id post.id
    json.title post.title
    json.excerpt post.excerpt
    json.published_at post.published_at
Fragment caching for expensive JSON serialization
Share this code
Here's the card — post it anywhere.