package httpmetrics

import "github.com/prometheus/client_golang/prometheus"

var (
	httpRequestDuration = prometheus.NewHistogramVec(
		prometheus.HistogramOpts{
			Name:    "http_request_duration_seconds",
			Help:    "Latency of HTTP requests in seconds.",
			Buckets: []float64{0.005, 0.01, 0.025, 0.05, 0.1, 0.25, 0.5, 1, 2.5, 5},
		},
		[]string{"method", "path", "status"},
	)

	httpRequestsTotal = prometheus.NewCounterVec(
		prometheus.CounterOpts{
			Name: "http_requests_total",
			Help: "Total number of HTTP requests processed.",
		},
		[]string{"method", "path", "status"},
	)
)

func init() {
	prometheus.MustRegister(httpRequestDuration, httpRequestsTotal)
}
package httpmetrics

import (
	"net/http"
	"strconv"
	"time"
)

type statusRecorder struct {
	http.ResponseWriter
	status      int
	wroteHeader bool
}

func (r *statusRecorder) WriteHeader(code int) {
	if r.wroteHeader {
		return
	}
	r.status = code
	r.wroteHeader = true
	r.ResponseWriter.WriteHeader(code)
}

func (r *statusRecorder) Write(b []byte) (int, error) {
	if !r.wroteHeader {
		r.WriteHeader(http.StatusOK)
	}
	return r.ResponseWriter.Write(b)
}

func Instrument(next http.Handler) http.Handler {
	return http.HandlerFunc(func(w http.ResponseWriter, req *http.Request) {
		start := time.Now()
		rec := &statusRecorder{ResponseWriter: w, status: http.StatusOK}

		next.ServeHTTP(rec, req)

		path := routePattern(req)
		status := strconv.Itoa(rec.status)
		httpRequestDuration.
			WithLabelValues(req.Method, path, status).
			Observe(time.Since(start).Seconds())
		httpRequestsTotal.
			WithLabelValues(req.Method, path, status).
			Inc()
	})
}

func routePattern(req *http.Request) string {
	if p := req.URL.Path; p != "" {
		if _, pattern := http.DefaultServeMux.Handler(req); pattern != "" {
			return pattern
		}
	}
	return "unmatched"
}
package main

import (
	"log"
	"net/http"

	"github.com/prometheus/client_golang/prometheus/promhttp"

	"example.com/app/httpmetrics"
)

func main() {
	mux := http.NewServeMux()
	mux.HandleFunc("/users/{id}", func(w http.ResponseWriter, r *http.Request) {
		w.Write([]byte("user " + r.PathValue("id")))
	})
	mux.HandleFunc("/health", func(w http.ResponseWriter, r *http.Request) {
		w.WriteHeader(http.StatusNoContent)
	})

	root := http.NewServeMux()
	root.Handle("/", httpmetrics.Instrument(mux))
	// Exposed outside the instrumented chain so scrapes aren't measured.
	root.Handle("/metrics", promhttp.Handler())

	log.Println("listening on :8080")
	if err := http.ListenAndServe(":8080", root); err != nil {
		log.Fatal(err)
	}
}
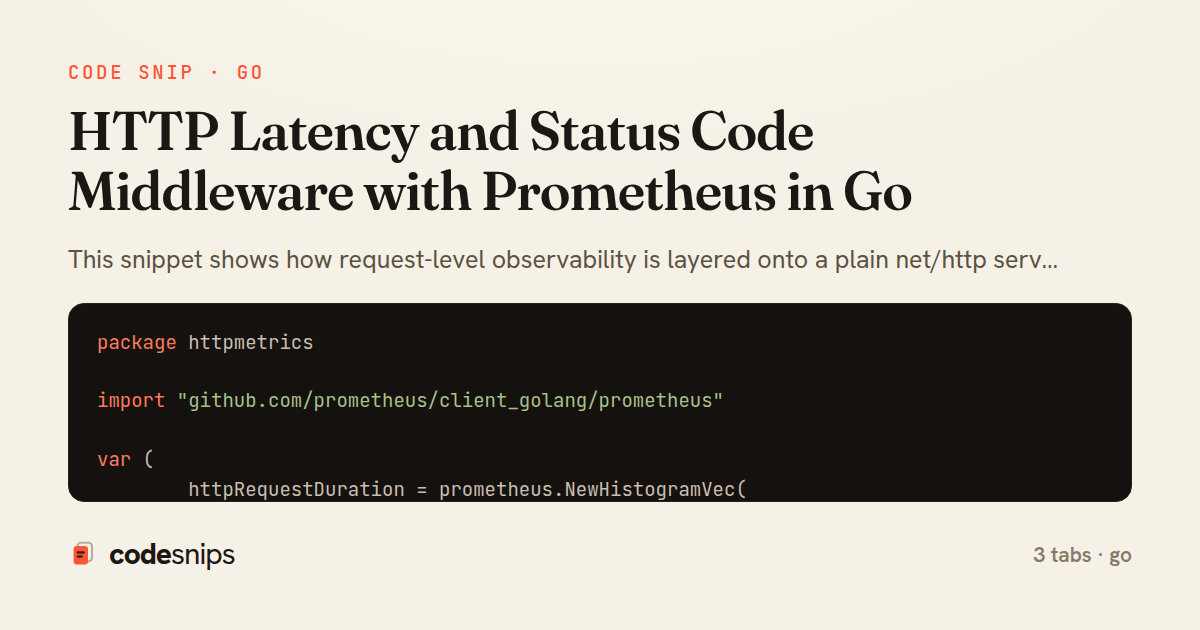
This snippet shows how request-level observability is layered onto a plain net/http server without touching handler logic. The pattern is a wrapping middleware: an http.Handler decorator that starts a timer before the inner handler runs and records the elapsed duration and final status code once it returns. Because it satisfies http.Handler, it composes with any router and with other middleware.
In metrics.go, two Prometheus collectors are registered. httpRequestDuration is a HistogramVec labelled by method, path, and status, so latency can be sliced per route and quantiles derived server-side. The bucket boundaries are chosen to straddle typical web latencies (5ms up to ~5s); buckets that are too coarse hide tail latency, while too many buckets inflate cardinality. httpRequestsTotal is a simple CounterVec for request throughput and error-rate math. Keeping the collectors in one place avoids the classic pitfall of registering the same metric twice, which panics at startup.
The key trick lives in middleware.go. Go's http.ResponseWriter does not expose the status code after the fact, so statusRecorder wraps it and intercepts WriteHeader to capture the code. It defaults to 200 because a handler that calls Write without WriteHeader implicitly sends 200. The Instrument function records time.Since(start) as an observation and increments the counter, using the normalized route template rather than the raw URL — this is critical, since labelling by full paths like /users/42 would explode metric cardinality and eventually crash the scrape.
The routePattern helper resolves the matched template from the request context so /users/{id} stays a single series. server.go wires everything together: routes are registered on a ServeMux, wrapped once by Instrument, and a separate /metrics endpoint exposes the Prometheus text format. Note the metrics handler is deliberately mounted outside the instrumented chain to avoid measuring the scraper itself. This approach is cheap, allocation-light, and framework-agnostic, making it the standard way to get RED metrics (Rate, Errors, Duration) out of a Go service.
Related snips
package api

import (
  "net/http"
  "runtime/debug"
)
Expose build metadata for debugging deploys
export interface RetryOptions {
  retries: number;
  baseMs: number;
  maxMs: number;
  signal?: AbortSignal;
  onRetry?: (attempt: number, delay: number, err: unknown) => void;
Exponential backoff with jitter for retries
package dbutil

import (
  "context"

  "github.com/jackc/pgconn"
Retry Postgres serialization failures with bounded attempts
use tracing::{info, instrument};

#[instrument]
fn process_request(user_id: u64) {
    info!(user_id, "Processing request");
    // Work happens here
tracing for structured logging and distributed tracing
package files

import (
  "context"
  "time"
Presigned S3 upload URLs (AWS SDK v2)
package deps

import (
  "net"
  "net/http"
  "time"
HTTP client tuned for production: timeouts, transport, and connection reuse
Share this code
Here's the card — post it anywhere.