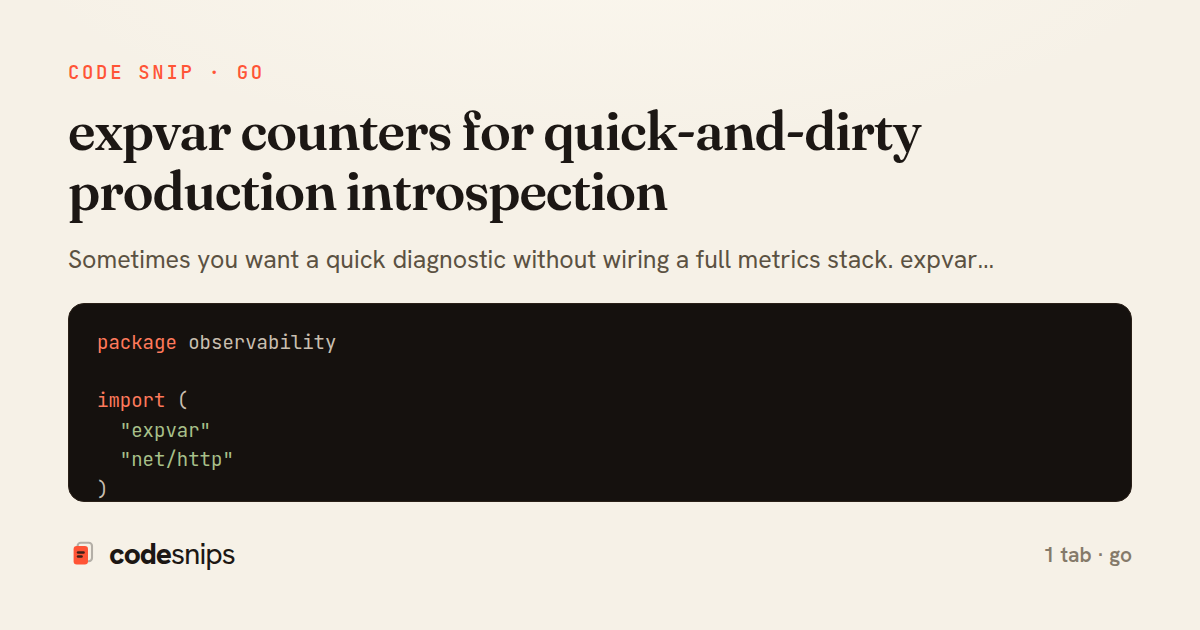
package observability

import (
  "expvar"
  "net/http"
)

var RequestsTotal = expvar.NewInt("requests_total")

func Register(mux *http.ServeMux) {
  mux.Handle("/debug/vars", expvar.Handler())
}
Sometimes you want a quick diagnostic without wiring a full metrics stack. expvar exposes variables at /debug/vars in a standard JSON format. I use it for a handful of counters like “requeststotal” and “jobsfailed” when I’m bootstrapping a service or debugging in a constrained environment. The important point is to keep variables low cardinality and avoid storing user data. Because expvar is global, I treat it as a debug interface: expose it only on an internal listener or behind auth. In production, Prometheus is usually better, but expvar is surprisingly useful for ad-hoc checks during incident response. It’s also nearly zero setup: define variables, increment them, and register the handler. This snippet shows a simple counter you can bump from handlers and jobs.
Related snips
package api

import (
  "net/http"
  "runtime/debug"
)
Expose build metadata for debugging deploys
package dbutil

import (
  "context"

  "github.com/jackc/pgconn"
Retry Postgres serialization failures with bounded attempts
use tracing::{info, instrument};

#[instrument]
fn process_request(user_id: u64) {
    info!(user_id, "Processing request");
    // Work happens here
tracing for structured logging and distributed tracing
package files

import (
  "context"
  "time"
Presigned S3 upload URLs (AWS SDK v2)
package deps

import (
  "net"
  "net/http"
  "time"
HTTP client tuned for production: timeouts, transport, and connection reuse
# Grafana provisioning: datasources
# /etc/grafana/provisioning/datasources/prometheus.yml
apiVersion: 1
datasources:
  - name: Prometheus
    type: prometheus
Grafana dashboards as code with JSON provisioning
Share this code
Here's the card — post it anywhere.