ruby
65 lines · 2 tabs
Alex Kumar
Jan 2026
2 tabs
class ExternalApiClient
  def fetch_user_data(user_id)
    ActiveSupport::Notifications.instrument(
      'api.external_service',
      service: 'user_service',
      operation: 'fetch_user',
      user_id: user_id
    ) do
      response = HTTP.get("https://api.example.com/users/#{user_id}")

      if response.status.success?
        JSON.parse(response.body)
      else
        raise ApiError, "Failed to fetch user: #{response.status}"
      end
    end
  rescue StandardError => e
    ActiveSupport::Notifications.instrument(
      'api.external_service.error',
      service: 'user_service',
      operation: 'fetch_user',
      error: e.class.name
    )
    raise e
  end
end
# Subscribe to custom events
ActiveSupport::Notifications.subscribe('api.external_service') do |name, start, finish, id, payload|
  duration = ((finish - start) * 1000).round(2)

  Rails.logger.info(
    event: 'external_api_call',
    service: payload[:service],
    operation: payload[:operation],
    duration_ms: duration,
    success: true
  )

  # Send to metrics service
  if defined?(Datadog::Statsd)
    statsd = Datadog::Statsd.new('localhost', 8125)
    statsd.histogram('api.external.duration', duration, tags: [
      "service:#{payload[:service]}",
      "operation:#{payload[:operation]}"
    ])
  end
end

ActiveSupport::Notifications.subscribe('api.external_service.error') do |name, start, finish, id, payload|
  Rails.logger.error(
    event: 'external_api_error',
    service: payload[:service],
    operation: payload[:operation],
    error: payload[:error]
  )

  if defined?(Datadog::Statsd)
    statsd = Datadog::Statsd.new('localhost', 8125)
    statsd.increment('api.external.errors', tags: [
      "service:#{payload[:service]}",
      "operation:#{payload[:operation]}",
      "error:#{payload[:error]}"
    ])
  end
end
2 files · ruby
Explain with highlit
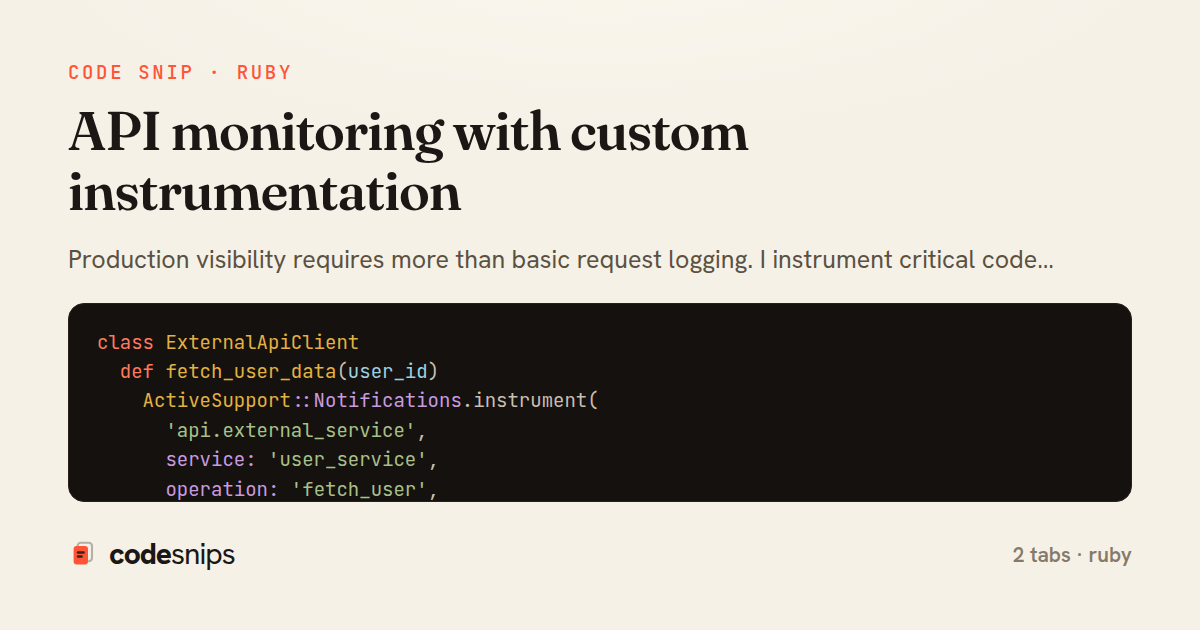
Production visibility requires more than basic request logging. I instrument critical code paths using ActiveSupport::Notifications to publish custom metrics that monitoring services consume. Each instrumented block publishes events with timing data, metadata, and success/failure indicators. I track business metrics like API calls to external services, cache hit rates, and background job durations. These metrics feed into dashboards and alerts that surface degradations before they become outages. The instrumentation API is lightweight and doesn't require external dependencies—I can log to Rails logger in development and ship to Datadog or StatsD in production by subscribing to the notification channel.
Related snips
go
package api

import (
  "net/http"
  "runtime/debug"
)
Expose build metadata for debugging deploys
go
observability
build
by Leah Thompson
1 tab
ruby
class CommentsController < ApplicationController
  before_action :set_post

  def create
    @comment = @post.comments.build(comment_params)
System test: asserting Turbo Stream responses
rails
hotwire
turbo
by codesnips
4 tabs
ruby
class Post < ApplicationRecord
  belongs_to :author, class_name: 'User'
  has_many :comments, dependent: :destroy

  scope :published, -> { where.not(published_at: nil).where('published_at <= ?', Time.current) }
  scope :draft, -> { where(published_at: nil) }
ActiveRecord scopes for reusable query logic
rails
activerecord
patterns
by Alex Kumar
1 tab
ruby
module Api
  module V1
    class UsersController < BaseController
      def show
        user = User.includes(:profile).find(params[:id])
ETags for conditional requests and caching
rails
caching
http-caching
by Alex Kumar
1 tab
ruby
class PostsController < ApplicationController
  def index
    @posts = Post.includes(:author)
                 .order(created_at: :desc)
                 .page(params[:page])
                 .per(10)
Turbo Frames: infinite scroll with lazy-loading frame
rails
turbo
hotwire
by codesnips
4 tabs
ruby
require "csv"

class PeopleCsvStream
  include Enumerable

  HEADERS = %w[id full_name email signed_up_at plan].freeze
Resilient CSV Export as a Streamed Response
rails
performance
streaming
by codesnips
3 tabs
Share this code
Here's the card — post it anywhere.