python
14 lines · 1 tab
Dr. Elena Vasquez
Apr 2026
1 tab
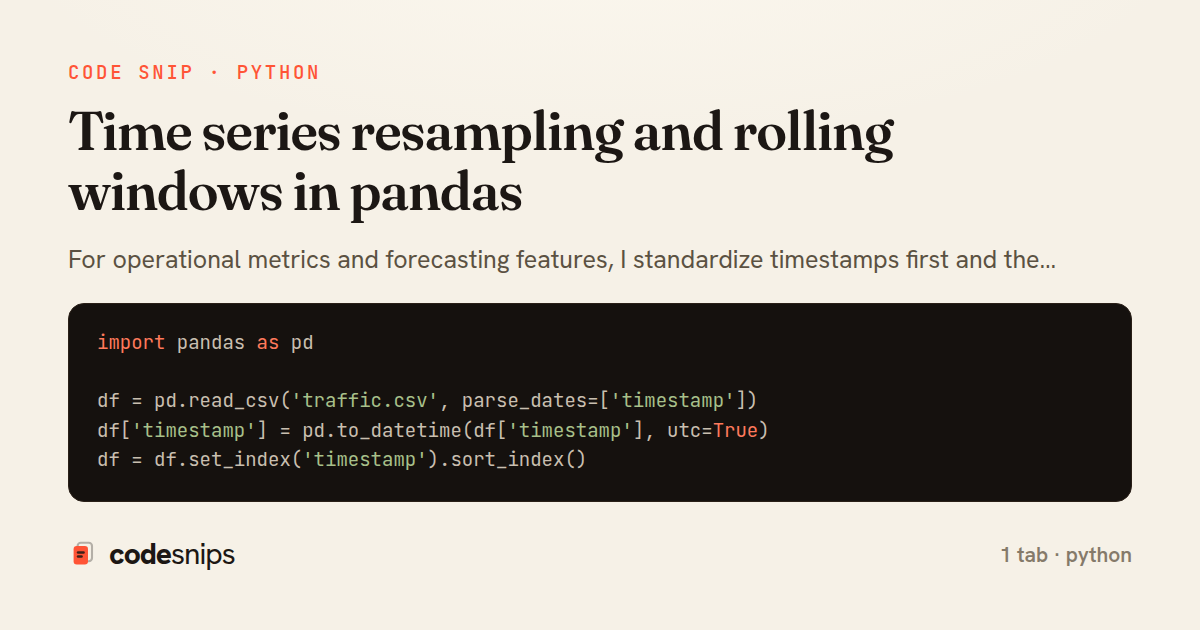
import pandas as pd

df = pd.read_csv('traffic.csv', parse_dates=['timestamp'])
df['timestamp'] = pd.to_datetime(df['timestamp'], utc=True)
df = df.set_index('timestamp').sort_index()

hourly = df.resample('1H').agg({'requests': 'sum', 'errors': 'sum'})
hourly['error_rate'] = hourly['errors'] / hourly['requests'].clip(lower=1)
hourly['requests_24h_mean'] = hourly['requests'].rolling('24H').mean()
hourly['requests_24h_std'] = hourly['requests'].rolling('24H').std()
hourly['requests_lag_1h'] = hourly['requests'].shift(1)
hourly['requests_growth'] = hourly['requests'].pct_change()

print(hourly.tail(10))
1 file · python
Explain with highlit
For operational metrics and forecasting features, I standardize timestamps first and then resample into stable windows. Rolling statistics like 7D means, lagged deltas, and volatility bands are easy wins for exploratory analysis. I avoid mixing timezone-naive and timezone-aware timestamps because it becomes a debugging tax later.
Related snips
python
import pandas as pd

df = pd.read_csv('customers.csv')

df.columns = df.columns.str.strip().str.lower().str.replace(' ', '_', regex=False)
Cleaning missing values and normalizing messy CSV exports
pandas
data-cleaning
missing-values
by Dr. Elena Vasquez
1 tab
sql
-- PostgreSQL Declarative Partitioning (10+)

-- Create partitioned table by date range
CREATE TABLE measurements (
  id BIGSERIAL,
  sensor_id INT NOT NULL,
Table partitioning for large datasets
database
partitioning
postgresql
by Maria Garcia
2 tabs
python
import pandas as pd

df = pd.read_parquet('events.parquet')
df['event_date'] = pd.to_datetime(df['event_date'])
df['month'] = df['event_date'].dt.to_period('M').astype(str)
GroupBy aggregations and pivot tables for business reporting
pandas
groupby
pivot-table
by Dr. Elena Vasquez
1 tab
rust
use std::collections::VecDeque;

pub struct RollingAverage {
    buf: VecDeque<f64>,
    capacity: usize,
    sum: f64,
Rolling Average Over a Sliding Window of Sensor Readings in Rust
rust
sliding-window
streaming
by codesnips
2 tabs
python
import pandas as pd

df = pd.read_csv(
    'orders.csv',
    parse_dates=['created_at'],
    dtype={
pandas DataFrame essentials: loading, indexing, and selection
pandas
python
dataframe
by Dr. Elena Vasquez
1 tab
go
package metrics

import "time"

type bucket struct {
	start time.Time
Time-Bucketed Metric Aggregation With a Concurrent Ring of Windows in Go
go
metrics
time-series
by codesnips
3 tabs
Share this code
Here's the card — post it anywhere.