python
20 lines · 1 tab
Dr. Elena Vasquez
Apr 2026
1 tab
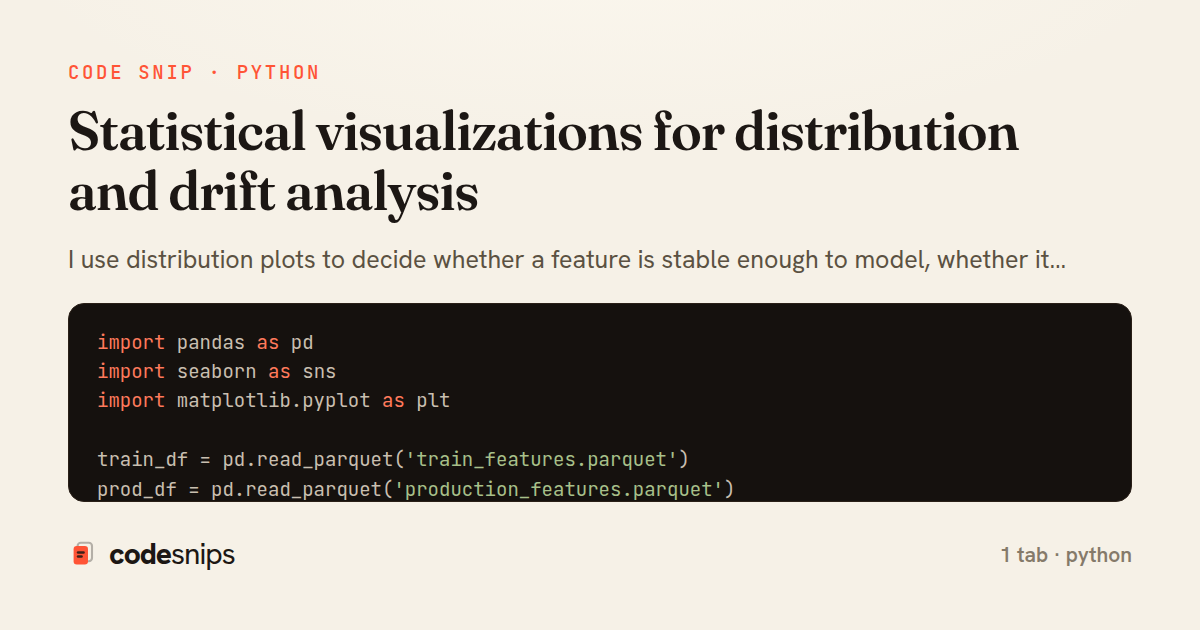
import pandas as pd
import seaborn as sns
import matplotlib.pyplot as plt

train_df = pd.read_parquet('train_features.parquet')
prod_df = pd.read_parquet('production_features.parquet')

train_df['dataset'] = 'train'
prod_df['dataset'] = 'production'

combined = pd.concat([
    train_df[['transaction_amount', 'dataset']],
    prod_df[['transaction_amount', 'dataset']],
])

sns.kdeplot(data=combined, x='transaction_amount', hue='dataset', fill=True, common_norm=False)
plt.xscale('log')
plt.title('Distribution drift for transaction_amount')
plt.tight_layout()
plt.show()
1 file · python
Explain with highlit
I use distribution plots to decide whether a feature is stable enough to model, whether it needs transformation, or whether data drift is already happening. Seaborn makes it easy to compare classes, cohorts, or time windows. The visual check usually catches things that summary statistics hide.
Share this code
Here's the card — post it anywhere.