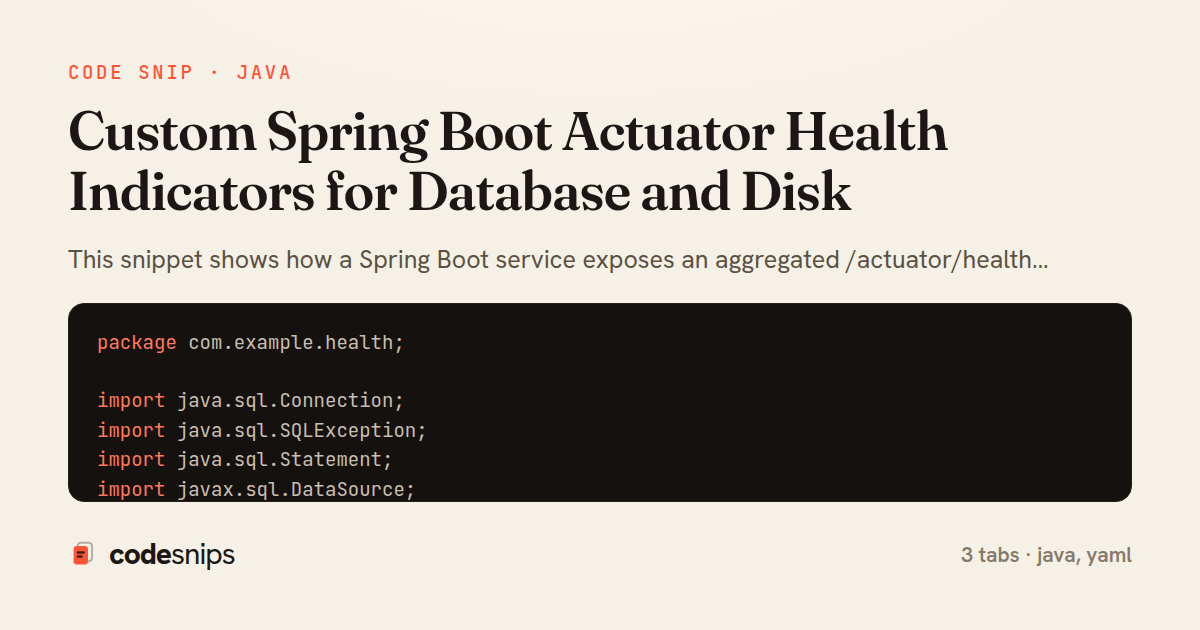
package com.example.health;

import java.sql.Connection;
import java.sql.SQLException;
import java.sql.Statement;
import javax.sql.DataSource;

import org.springframework.beans.factory.annotation.Value;
import org.springframework.boot.actuate.health.Health;
import org.springframework.boot.actuate.health.HealthIndicator;
import org.springframework.stereotype.Component;

@Component("database")
public class DatabaseHealthIndicator implements HealthIndicator {

    private final DataSource dataSource;
    private final String validationQuery;

    public DatabaseHealthIndicator(DataSource dataSource,
            @Value("${health.db.validation-query:SELECT 1}") String validationQuery) {
        this.dataSource = dataSource;
        this.validationQuery = validationQuery;
    }

    @Override
    public Health health() {
        long start = System.currentTimeMillis();
        try (Connection connection = dataSource.getConnection();
                Statement statement = connection.createStatement()) {
            statement.setQueryTimeout(2);
            statement.execute(validationQuery);
            return Health.up()
                    .withDetail("query", validationQuery)
                    .withDetail("responseMillis", System.currentTimeMillis() - start)
                    .withDetail("catalog", connection.getCatalog())
                    .build();
        } catch (SQLException ex) {
            return Health.down(ex)
                    .withDetail("query", validationQuery)
                    .build();
        }
    }
}
package com.example.health;

import java.io.File;

import org.springframework.beans.factory.annotation.Value;
import org.springframework.boot.actuate.health.Health;
import org.springframework.boot.actuate.health.HealthIndicator;
import org.springframework.stereotype.Component;

@Component("diskSpace")
public class DiskSpaceHealthIndicator implements HealthIndicator {

    private final File path;
    private final long threshold;

    public DiskSpaceHealthIndicator(
            @Value("${health.disk.path:.}") String path,
            @Value("${health.disk.threshold-bytes:104857600}") long threshold) {
        this.path = new File(path);
        this.threshold = threshold;
    }

    @Override
    public Health health() {
        long free = path.getUsableSpace();
        long total = path.getTotalSpace();
        Health.Builder builder = free >= threshold ? Health.up() : Health.down();
        return builder
                .withDetail("path", path.getAbsolutePath())
                .withDetail("free", free)
                .withDetail("total", total)
                .withDetail("threshold", threshold)
                .build();
    }
}
health:
  db:
    validation-query: "SELECT 1"
  disk:
    path: "/data"
    threshold-bytes: 262144000

management:
  endpoint:
    health:
      show-details: always
      probes:
        enabled: true
      group:
        readiness:
          include: database,diskSpace
          show-details: always
        liveness:
          include: ping
  endpoints:
    web:
      exposure:
        include: health,info
      base-path: /actuator
This snippet shows how a Spring Boot service exposes an aggregated /actuator/health endpoint backed by two custom indicators — one that verifies database connectivity and one that checks free disk space — plus the configuration that wires them into a readiness group for Kubernetes probes.
Spring Boot's actuator already ships with DataSourceHealthIndicator and DiskSpaceHealthIndicator, but a real service usually needs to add domain-specific detail: a bespoke validation query, custom thresholds, and extra fields in the response. The pattern is to implement the HealthIndicator interface, whose single health() method returns a Health object built with Health.up(), Health.down(), or Health.outOfService(). The framework discovers every such @Component by bean name and contributes it to the overall status, taking the worst individual status as the aggregate.
In DatabaseHealthIndicator, the check borrows a Connection from the injected DataSource and runs a lightweight validationQuery inside a try-with-resources block so the connection is always returned to the pool. A successful query yields Health.up() enriched with withDetail metadata; any SQLException is caught and mapped to Health.down(ex), which attaches the exception without letting it bubble up and crash the endpoint. Running a real query rather than trusting Connection.isValid() catches cases where the pool is alive but the database is rejecting statements.
In DiskSpaceHealthIndicator, File.getUsableSpace() is compared against a configurable threshold. When free space drops below the limit the indicator reports DOWN, otherwise UP, and both branches expose free, threshold, and path details so operators can see the actual numbers. This is the classic guardrail against a service that keeps accepting writes until the volume fills and corrupts state.
In HealthConfig, application.yml turns on show-details: always, registers the two indicators under the readiness group, and enables probes so Kubernetes gets distinct livenessState and readinessState endpoints. Grouping matters: a full disk should fail readiness (stop routing traffic) without failing liveness (which would trigger a pointless restart). The main trade-off is that health checks run on the probe thread, so both queries are deliberately cheap and time-bounded to avoid turning a monitoring endpoint into a source of load.
Related snips
package api

import (
  "net/http"
  "runtime/debug"
)
Expose build metadata for debugging deploys
export interface RetryOptions {
  retries: number;
  baseMs: number;
  maxMs: number;
  signal?: AbortSignal;
  onRetry?: (attempt: number, delay: number, err: unknown) => void;
Exponential backoff with jitter for retries
package dbutil

import (
  "context"

  "github.com/jackc/pgconn"
Retry Postgres serialization failures with bounded attempts
type User {
    id: ID!
    name: String!
    email: String!
    posts: [Post!]!
    createdAt: String!
GraphQL API with Spring Boot
use tracing::{info, instrument};

#[instrument]
fn process_request(user_id: u64) {
    info!(user_id, "Processing request");
    // Work happens here
tracing for structured logging and distributed tracing
package com.example.starter.config;

import com.example.starter.properties.CustomProperties;
import com.example.starter.service.CustomService;
import org.springframework.boot.autoconfigure.AutoConfiguration;
import org.springframework.boot.autoconfigure.condition.ConditionalOnClass;
Custom Spring Boot starters
Share this code
Here's the card — post it anywhere.