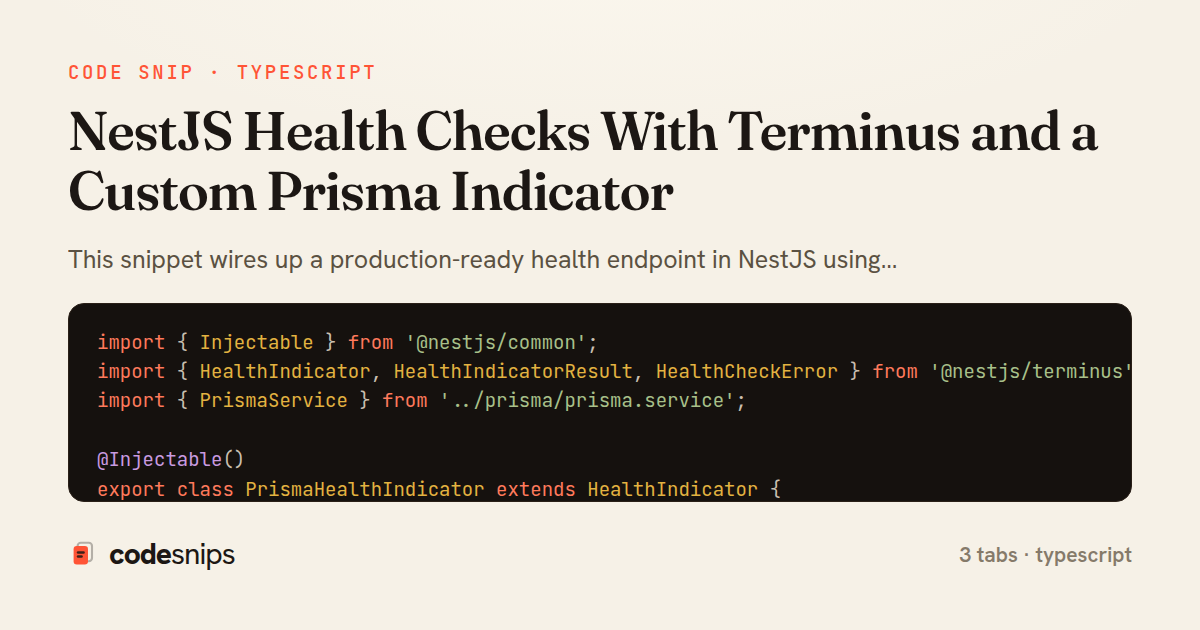
import { Injectable } from '@nestjs/common';
import { HealthIndicator, HealthIndicatorResult, HealthCheckError } from '@nestjs/terminus';
import { PrismaService } from '../prisma/prisma.service';

@Injectable()
export class PrismaHealthIndicator extends HealthIndicator {
  constructor(private readonly prisma: PrismaService) {
    super();
  }

  async isHealthy(key: string): Promise<HealthIndicatorResult> {
    try {
      await this.prisma.$queryRaw`SELECT 1`;
      return this.getStatus(key, true);
    } catch (error) {
      const message = error instanceof Error ? error.message : 'unreachable';
      const result = this.getStatus(key, false, { message });
      throw new HealthCheckError('Prisma check failed', result);
    }
  }
}
import { Controller, Get } from '@nestjs/common';
import { HealthCheck, HealthCheckService, DiskHealthIndicator } from '@nestjs/terminus';
import { PrismaHealthIndicator } from './prisma-health.indicator';

@Controller('health')
export class HealthController {
  constructor(
    private readonly health: HealthCheckService,
    private readonly disk: DiskHealthIndicator,
    private readonly prisma: PrismaHealthIndicator,
  ) {}

  @Get('live')
  @HealthCheck()
  live() {
    // Liveness: process is running, no dependency probing.
    return this.health.check([]);
  }

  @Get('ready')
  @HealthCheck()
  ready() {
    return this.health.check([
      () => this.prisma.isHealthy('database'),
      () => this.disk.checkStorage('storage', { path: '/', thresholdPercent: 0.9 }),
    ]);
  }
}
import { Module } from '@nestjs/common';
import { TerminusModule } from '@nestjs/terminus';
import { HealthController } from './health.controller';
import { PrismaHealthIndicator } from './prisma-health.indicator';
import { PrismaService } from '../prisma/prisma.service';

@Module({
  imports: [TerminusModule],
  controllers: [HealthController],
  providers: [PrismaHealthIndicator, PrismaService],
})
export class HealthModule {}
This snippet wires up a production-ready health endpoint in NestJS using @nestjs/terminus, the framework's official wrapper around the Terminus library. The goal is to expose the twin probes that container orchestrators like Kubernetes expect: a cheap liveness signal that says the process is up, and a deeper readiness signal that confirms downstream dependencies are actually reachable before traffic is routed to the pod.
The PrismaHealthIndicator in the first tab shows how to build a custom indicator when the built-in TypeOrmHealthIndicator or HTTP checks do not fit. It extends HealthIndicator, which supplies the getStatus helper that formats results into Terminus's expected { key: { status } } shape. The isHealthy method runs a trivial SELECT 1 through Prisma's $queryRaw — the lightest query that still proves the connection pool can round-trip to the database. On success it returns an up result; on failure it wraps the error detail and throws a HealthCheckError, which is the contract Terminus relies on to mark the aggregate check as failed.
Using $queryRaw rather than a full model query is deliberate: it avoids table locks, permission surprises, and schema coupling, so the probe measures connectivity rather than application correctness. Because indicators are ordinary providers, the indicator receives PrismaService through constructor injection like any other service.
The HealthController in the second tab composes the checks. The /health/live route intentionally does nothing but return, so liveness never fails just because the database is slow — that separation prevents a temporary dependency outage from triggering pod restarts. The /health/ready route passes an array of async callbacks to this.health.check, and Terminus runs them, aggregates statuses, and returns HTTP 200 or 503 accordingly. Here it combines the custom prisma.isHealthy check with a disk.checkStorage threshold, demonstrating how multiple indicators cooperate.
The HealthModule tab registers everything by importing TerminusModule and declaring the controller plus the two providers. A common pitfall is forgetting to provide PrismaService in this module's scope, which yields an unresolved-dependency error at boot. Keeping liveness and readiness distinct, and keeping the readiness query minimal, is what makes this pattern safe to hammer at high frequency.
Related snips
package api

import (
  "net/http"
  "runtime/debug"
)
Expose build metadata for debugging deploys
package com.example.myapp

import android.app.Application
import dagger.hilt.android.HiltAndroidApp

@HiltAndroidApp
Dependency injection with Hilt
use tracing::{info, instrument};

#[instrument]
fn process_request(user_id: u64) {
    info!(user_id, "Processing request");
    // Work happens here
tracing for structured logging and distributed tracing
<?php

namespace App\Providers;

use App\Contracts\PaymentGateway;
use App\Services\StripePaymentGateway;
Laravel service container and dependency injection
import pandas as pd
from sklearn.ensemble import IsolationForest

df = pd.read_csv('service_metrics.csv')
features = df[['latency_p95', 'error_rate', 'throughput', 'cpu_utilization']]
Anomaly detection with isolation forest and robust thresholds
# Grafana provisioning: datasources
# /etc/grafana/provisioning/datasources/prometheus.yml
apiVersion: 1
datasources:
  - name: Prometheus
    type: prometheus
Grafana dashboards as code with JSON provisioning
Share this code
Here's the card — post it anywhere.