package com.example.health;

import org.springframework.boot.actuate.health.Health;
import org.springframework.boot.actuate.health.HealthIndicator;
import org.springframework.stereotype.Component;

@Component("queue")
public class QueueHealthIndicator implements HealthIndicator {

    private final WorkQueueClient queue;
    private final HealthProperties props;

    public QueueHealthIndicator(WorkQueueClient queue, HealthProperties props) {
        this.queue = queue;
        this.props = props;
    }

    @Override
    public Health health() {
        try {
            long depth = queue.pendingCount();
            long oldestAgeMs = queue.oldestMessageAgeMillis();

            Health.Builder builder = depth >= props.maxDepth()
                    ? Health.down()
                    : Health.up();

            return builder
                    .withDetail("depth", depth)
                    .withDetail("warnDepth", props.warnDepth())
                    .withDetail("maxDepth", props.maxDepth())
                    .withDetail("oldestMessageAgeMs", oldestAgeMs)
                    .withDetail("nearingLimit", depth >= props.warnDepth())
                    .build();
        } catch (Exception e) {
            return Health.down()
                    .withDetail("reason", "queue probe failed")
                    .withException(e)
                    .build();
        }
    }
}
package com.example.health;

import org.springframework.boot.context.properties.ConfigurationProperties;
import org.springframework.boot.context.properties.bind.DefaultValue;

@ConfigurationProperties(prefix = "app.queue.health")
public record HealthProperties(
        @DefaultValue("500") long warnDepth,
        @DefaultValue("2000") long maxDepth) {

    public HealthProperties {
        if (maxDepth < warnDepth) {
            throw new IllegalArgumentException("maxDepth must be >= warnDepth");
        }
    }
}
app:
  queue:
    health:
      warn-depth: 500
      max-depth: 2000

management:
  endpoints:
    web:
      exposure:
        include: health,info
  endpoint:
    health:
      show-details: when-authorized
      group:
        readiness:
          include: queue,db
        liveness:
          include: ping
package com.example.health;

import org.springframework.boot.context.properties.EnableConfigurationProperties;
import org.springframework.context.annotation.Configuration;

@Configuration
@EnableConfigurationProperties(HealthProperties.class)
public class PropertiesConfig {
}
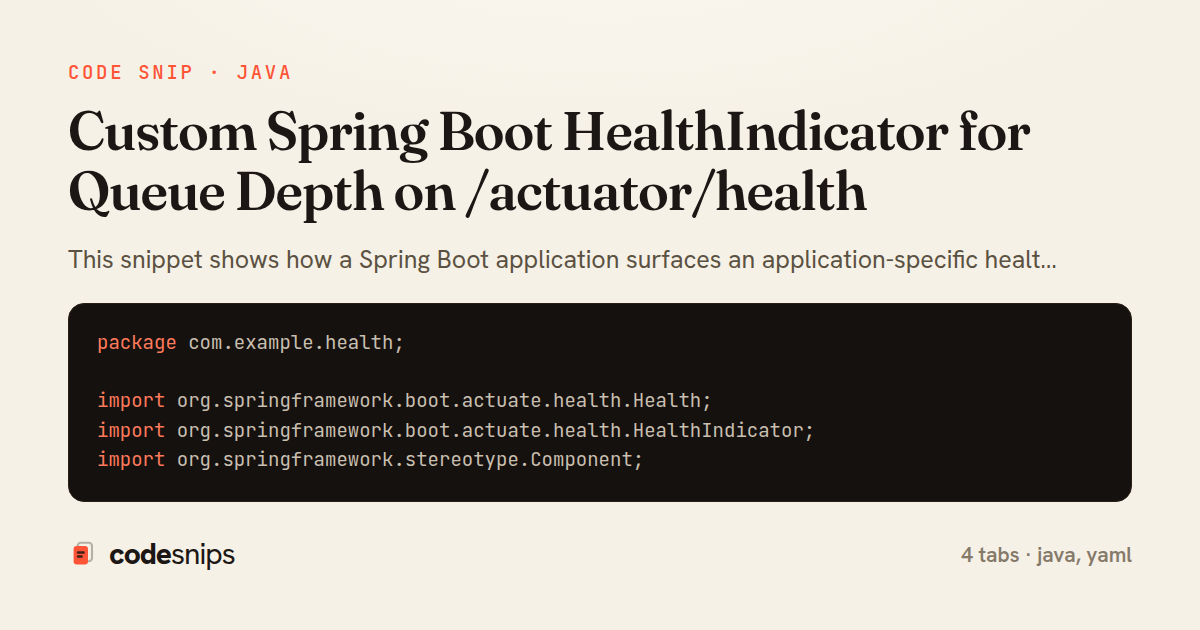
This snippet shows how a Spring Boot application surfaces an application-specific health signal — the depth of an internal work queue — through the /actuator/health endpoint using a custom HealthIndicator bean. Actuator aggregates every HealthIndicator in the context into the overall status, so registering one bean is enough to make the new signal visible to load balancers, Kubernetes probes, and dashboards without any extra wiring.
In QueueHealthIndicator, the class implements HealthIndicator and overrides health(). The core rule is expressed with the Health builder: below a warning threshold it reports Health.up(), and once the queue backlog crosses a configured limit it reports Health.down(). Regardless of status it attaches contextual detail via withDetail — the current depth, the configured limit, and the oldest-message age — so an operator reading the JSON can see why the component is unhealthy, not just that it is. The indicator is deliberately defensive: any exception from the queue client is caught and converted into Health.down().withException(e) rather than being allowed to propagate, because a health check that throws is worse than one that reports failure.
The thresholds live in HealthProperties, a @ConfigurationProperties bean bound to the app.queue.health prefix. Externalising warnDepth and maxDepth means operators can tune sensitivity per environment through normal Spring configuration instead of recompiling. Binding through a typed record keeps the indicator free of magic numbers.
application.yml completes the picture. It enables @ConfigurationProperties scanning, sets the property values, and — importantly — configures management.endpoint.health.show-details: when-authorized plus a group named readiness that includes only the queue indicator. Grouping matters in Kubernetes: the liveness probe should not fail on a full queue (the process is alive and can recover), while the readiness probe should pull the pod out of rotation until the backlog drains. The trade-off to weigh is that a DOWN component drags the aggregate status to DOWN, so an indicator that is too aggressive can cause needless restarts or traffic loss; choosing warnDepth versus maxDepth and mapping only the right indicators into probe groups is what keeps the signal actionable rather than noisy.
Related snips
package api

import (
  "net/http"
  "runtime/debug"
)
Expose build metadata for debugging deploys
export interface RetryOptions {
  retries: number;
  baseMs: number;
  maxMs: number;
  signal?: AbortSignal;
  onRetry?: (attempt: number, delay: number, err: unknown) => void;
Exponential backoff with jitter for retries
type User {
    id: ID!
    name: String!
    email: String!
    posts: [Post!]!
    createdAt: String!
GraphQL API with Spring Boot
use tracing::{info, instrument};

#[instrument]
fn process_request(user_id: u64) {
    info!(user_id, "Processing request");
    // Work happens here
tracing for structured logging and distributed tracing
package com.example.starter.config;

import com.example.starter.properties.CustomProperties;
import com.example.starter.service.CustomService;
import org.springframework.boot.autoconfigure.AutoConfiguration;
import org.springframework.boot.autoconfigure.condition.ConditionalOnClass;
Custom Spring Boot starters
import pandas as pd
from sklearn.ensemble import IsolationForest

df = pd.read_csv('service_metrics.csv')
features = df[['latency_p95', 'error_rate', 'throughput', 'cpu_utilization']]
Anomaly detection with isolation forest and robust thresholds
Share this code
Here's the card — post it anywhere.