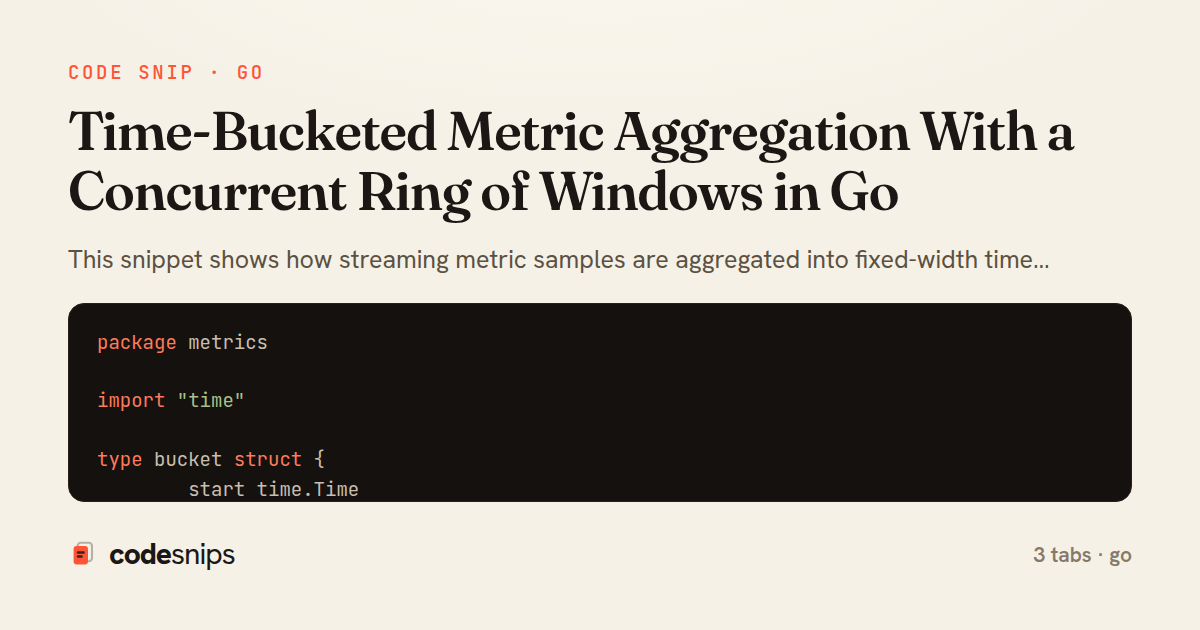
package metrics

import "time"

type bucket struct {
	start time.Time
	count int64
	sum   float64
	min   float64
	max   float64
}

type Window struct {
	Start time.Time
	Count int64
	Sum   float64
	Min   float64
	Max   float64
}

func (b *bucket) reset(start time.Time) {
	b.start = start
	b.count = 0
	b.sum = 0
	b.min = 0
	b.max = 0
}

func (b *bucket) observe(v float64) {
	if b.count == 0 || v < b.min {
		b.min = v
	}
	if b.count == 0 || v > b.max {
		b.max = v
	}
	b.count++
	b.sum += v
}

func (b *bucket) snapshot() Window {
	return Window{
		Start: b.start,
		Count: b.count,
		Sum:   b.sum,
		Min:   b.min,
		Max:   b.max,
	}
}

func (w Window) Avg() float64 {
	if w.Count == 0 {
		return 0
	}
	return w.Sum / float64(w.Count)
}
package metrics
import (
"sort"
"sync"
"time"
)
type Aggregator struct {
mu sync.Mutex
width time.Duration
size int
ring []bucket
}
func New(width time.Duration, size int) *Aggregator {
return &Aggregator{
width: width,
size: size,
ring: make([]bucket, size),
}
}
func (a *Aggregator) bucketStart(t time.Time) time.Time {
return t.Truncate(a.width)
}
func (a *Aggregator) Observe(t time.Time, v float64) {
start := a.bucketStart(t)
idx := int(start.UnixNano()/int64(a.width)) % a.size
if idx < 0 {
idx += a.size
}
a.mu.Lock()
b := &a.ring[idx]
if !b.start.Equal(start) {
b.reset(start)
}
b.observe(v)
a.mu.Unlock()
}
func (a *Aggregator) Windows() []Window {
a.mu.Lock()
out := make([]Window, 0, a.size)
for i := range a.ring {
if a.ring[i].count > 0 {
out = append(out, a.ring[i].snapshot())
}
}
a.mu.Unlock()
sort.Slice(out, func(i, j int) bool {
return out[i].Start.Before(out[j].Start)
})
return out
}package main
import (
"fmt"
"math/rand"
"sync"
"time"
"example.com/app/metrics"
)
func main() {
agg := metrics.New(time.Second, 8)
var wg sync.WaitGroup
stop := time.After(5 * time.Second)
for p := 0; p < 4; p++ {
wg.Add(1)
go func() {
defer wg.Done()
ticker := time.NewTicker(10 * time.Millisecond)
defer ticker.Stop()
for {
select {
case now := <-ticker.C:
agg.Observe(now, rand.Float64()*100)
case <-stop:
return
}
}
}()
}
report := time.NewTicker(time.Second)
defer report.Stop()
for {
select {
case <-report.C:
for _, w := range agg.Windows() {
fmt.Printf("%s n=%d avg=%.1f min=%.1f max=%.1f\n",
w.Start.Format("15:04:05"), w.Count, w.Avg(), w.Min, w.Max)
}
case <-stop:
wg.Wait()
return
}
}
}This snippet shows how streaming metric samples are aggregated into fixed-width time buckets (tumbling windows) so that a high-throughput ingest path stays cheap while readers get coarse per-window summaries. The core idea is to avoid storing every raw sample: instead each sample is folded into a running bucket keyed by the truncated timestamp, and only the compact aggregate (count, sum, min, max) survives.
In bucket.go, a bucket holds the aggregate state for one window plus the start time it covers. observe updates the running totals in place, and snapshot freezes the current state into a Window value that is safe to hand to callers. Keeping bucket mutable and Window immutable draws a clear line between internal accumulation and external reads.
In aggregator.go, Aggregator owns a ring of buckets of length size, which caps memory regardless of how long the process runs — old windows are overwritten as time advances. bucketStart truncates a timestamp down to the window boundary using integer division, giving every sample in the same interval an identical key. Observe computes that boundary, finds the ring slot with a modulo of the window index, and lazily resets the slot when it belongs to an older window (b.start != start). A single sync.Mutex guards the ring; the critical section is tiny — just a few field updates — so contention stays low even under heavy fan-in from many goroutines.
Windows walks the ring and returns a snapshot slice of only the live, non-empty buckets, sorted by start time, so a scrape endpoint sees a stable view. Because the ring is fixed, a slow reader can never cause unbounded growth; the trade-off is that windows older than size intervals are silently dropped.
In main.go, several goroutines simulate concurrent producers calling Observe, while the main goroutine periodically calls Windows and prints each window's average. This mirrors a real collector where request-latency samples arrive continuously and a metrics handler exposes rolled-up windows. The pattern suits rate, latency, and throughput dashboards where per-sample fidelity is unnecessary and bounded memory matters more than completeness.
Related snips
package api

import (
  "net/http"
  "runtime/debug"
)
Expose build metadata for debugging deploys
package dbutil

import (
  "context"

  "github.com/jackc/pgconn"
Retry Postgres serialization failures with bounded attempts
require "csv"

class PeopleCsvStream
  include Enumerable

  HEADERS = %w[id full_name email signed_up_at plan].freeze
Resilient CSV Export as a Streamed Response
// Creating a Promise
const myPromise = new Promise((resolve, reject) => {
  const success = true;

  setTimeout(() => {
    if (success) {
Promises and async/await patterns for asynchronous JavaScript
use crossbeam::channel::unbounded;
use std::thread;

fn main() {
    let (tx, rx) = unbounded();
Crossbeam for advanced concurrent data structures
use tracing::{info, instrument};

#[instrument]
fn process_request(user_id: u64) {
    info!(user_id, "Processing request");
    // Work happens here
tracing for structured logging and distributed tracing
Share this code
Here's the card — post it anywhere.