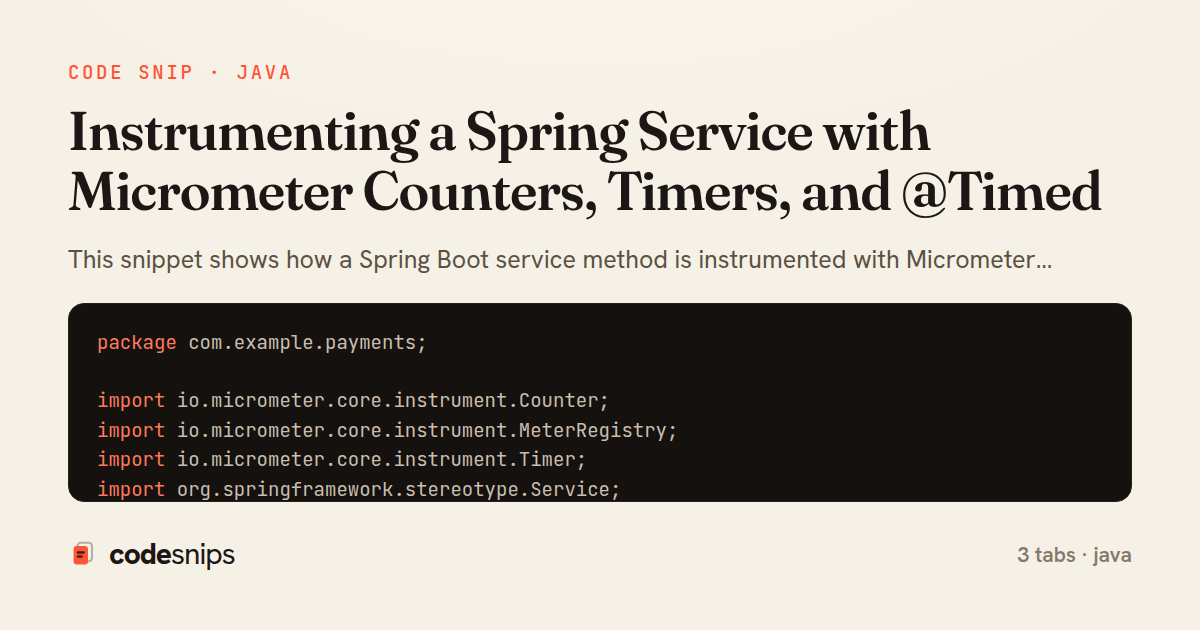
package com.example.payments;

import io.micrometer.core.instrument.Counter;
import io.micrometer.core.instrument.MeterRegistry;
import io.micrometer.core.instrument.Timer;
import org.springframework.stereotype.Service;

import java.time.Duration;

@Service
public class PaymentService {

    private final PaymentGateway gateway;
    private final Counter processed;
    private final Counter failed;
    private final Timer latency;

    public PaymentService(PaymentGateway gateway, MeterRegistry registry) {
        this.gateway = gateway;
        this.processed = Counter.builder("payments.processed")
                .description("Payments handled by the service")
                .tag("result", "success")
                .register(registry);
        this.failed = Counter.builder("payments.processed")
                .tag("result", "failed")
                .register(registry);
        this.latency = Timer.builder("payments.charge.latency")
                .description("Time to charge a payment")
                .publishPercentileHistogram()
                .serviceLevelObjectives(Duration.ofMillis(100), Duration.ofMillis(500))
                .register(registry);
    }

    public Receipt charge(ChargeRequest request) {
        return latency.record(() -> {
            try {
                Receipt receipt = gateway.submit(request);
                processed.increment();
                return receipt;
            } catch (GatewayException ex) {
                failed.increment();
                throw ex;
            }
        });
    }
}
package com.example.payments;

import io.micrometer.core.annotation.Timed;
import org.springframework.http.ResponseEntity;
import org.springframework.web.bind.annotation.PostMapping;
import org.springframework.web.bind.annotation.RequestBody;
import org.springframework.web.bind.annotation.RequestMapping;
import org.springframework.web.bind.annotation.RestController;

@RestController
@RequestMapping("/api/payments")
public class PaymentController {

    private final PaymentService service;

    public PaymentController(PaymentService service) {
        this.service = service;
    }

    @PostMapping
    @Timed(value = "payments.http.charge", description = "HTTP charge endpoint", percentiles = {0.95, 0.99})
    public ResponseEntity<Receipt> charge(@RequestBody ChargeRequest request) {
        Receipt receipt = service.charge(request);
        return ResponseEntity.ok(receipt);
    }
}
package com.example.payments;

import io.micrometer.core.aop.TimedAspect;
import io.micrometer.core.instrument.MeterRegistry;
import io.micrometer.core.instrument.config.MeterFilter;
import org.springframework.boot.actuate.autoconfigure.metrics.MeterRegistryCustomizer;
import org.springframework.context.annotation.Bean;
import org.springframework.context.annotation.Configuration;

@Configuration
public class MetricsConfig {

    @Bean
    public TimedAspect timedAspect(MeterRegistry registry) {
        return new TimedAspect(registry);
    }

    @Bean
    public MeterRegistryCustomizer<MeterRegistry> commonTags() {
        return registry -> registry.config().meterFilter(
                MeterFilter.commonTags(java.util.List.of(
                        io.micrometer.core.instrument.Tag.of("application", "payments-service"),
                        io.micrometer.core.instrument.Tag.of("region", "eu-west-1")
                )));
    }
}
This snippet shows how a Spring Boot service method is instrumented with Micrometer so operational metrics — throughput, error rate, and latency distribution — are emitted to whatever backend (Prometheus, Datadog, etc.) the application is wired to. The pattern separates the two dominant metric primitives: a Counter for discrete events that only ever increase, and a Timer for capturing both a count and a latency histogram in one instrument.
In PaymentService, dependencies are injected as a single MeterRegistry, and the concrete meters are built eagerly in the constructor rather than looked up on every call. Building Counter and Timer once and reusing them avoids repeated map lookups on the hot path and lets tags be fixed up front. The processed and failed counters share the same metric name payments.processed but differ by a result tag, which is the idiomatic Micrometer way to model related outcomes — a dashboard can then compute error rate as failed / (success + failed) by aggregating over that dimension.
The latency is recorded with timer.record(Supplier), which times the enclosed lambda, records the duration, and rethrows any exception so the business behaviour is unchanged. Because timing wraps the real work, the Timer also captures a natural count, so a separate call counter is unnecessary. The publishPercentileHistogram and serviceLevelObjectives on the builder produce a proper histogram so p95/p99 can be computed accurately server-side rather than from client-side approximations.
PaymentController demonstrates the declarative alternative: the @Timed annotation delegates instrumentation to TimedAspect so the controller stays free of metric code. Note that @Timed requires the aspect bean, defined in MetricsConfig as a TimedAspect over the MeterRegistry; without it the annotation is silently ignored — a common pitfall.
MetricsConfig also registers a MeterFilter common tag so every meter carries application and region tags, which keeps dashboards consistent across services. A key trade-off is cardinality: tags like result are bounded and safe, but tagging with unbounded values such as a payment id would explode the time-series count and should be avoided. This approach fits any service where per-method throughput and latency need to be observable in production.
Related snips
package api

import (
  "net/http"
  "runtime/debug"
)
Expose build metadata for debugging deploys
type User {
    id: ID!
    name: String!
    email: String!
    posts: [Post!]!
    createdAt: String!
GraphQL API with Spring Boot
use tracing::{info, instrument};

#[instrument]
fn process_request(user_id: u64) {
    info!(user_id, "Processing request");
    // Work happens here
tracing for structured logging and distributed tracing
package com.example.starter.config;

import com.example.starter.properties.CustomProperties;
import com.example.starter.service.CustomService;
import org.springframework.boot.autoconfigure.AutoConfiguration;
import org.springframework.boot.autoconfigure.condition.ConditionalOnClass;
Custom Spring Boot starters
import pandas as pd
from sklearn.ensemble import IsolationForest

df = pd.read_csv('service_metrics.csv')
features = df[['latency_p95', 'error_rate', 'throughput', 'cpu_utilization']]
Anomaly detection with isolation forest and robust thresholds
# Grafana provisioning: datasources
# /etc/grafana/provisioning/datasources/prometheus.yml
apiVersion: 1
datasources:
  - name: Prometheus
    type: prometheus
Grafana dashboards as code with JSON provisioning
Share this code
Here's the card — post it anywhere.