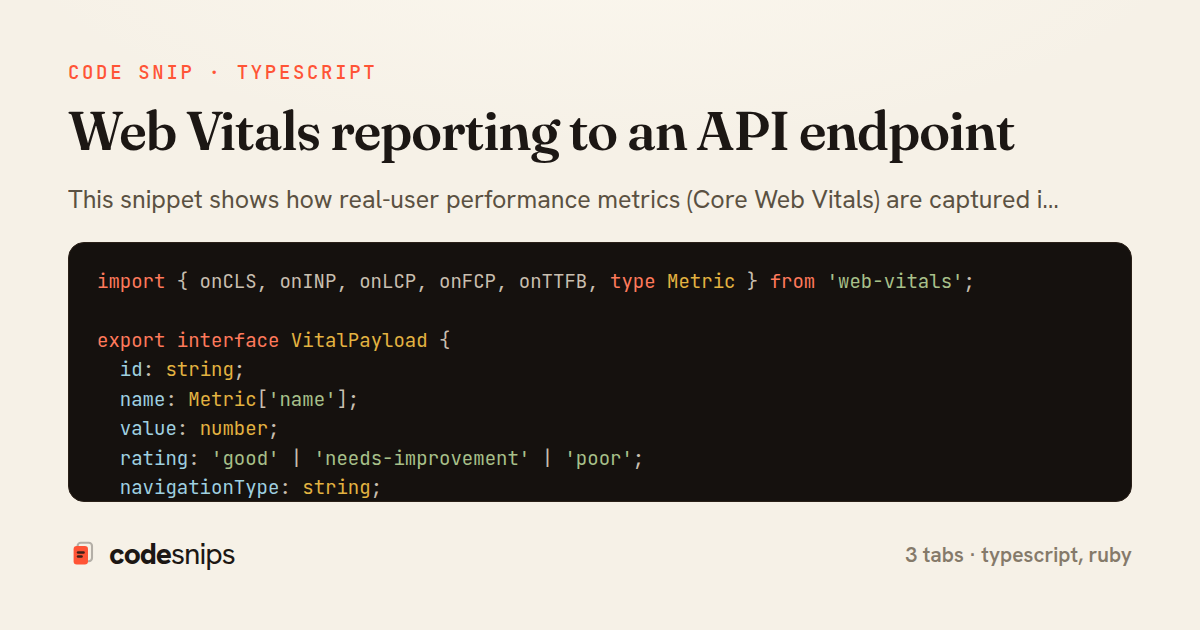
import { onCLS, onINP, onLCP, onFCP, onTTFB, type Metric } from 'web-vitals';

export interface VitalPayload {
  id: string;
  name: Metric['name'];
  value: number;
  rating: 'good' | 'needs-improvement' | 'poor';
  navigationType: string;
  path: string;
}

const ENDPOINT = '/api/web_vitals';
let buffer: VitalPayload[] = [];

function record(metric: Metric): void {
  buffer.push({
    id: metric.id,
    name: metric.name,
    value: Math.round(metric.value * 100) / 100,
    rating: metric.rating,
    navigationType: metric.navigationType,
    path: window.location.pathname,
  });
}

function flush(): void {
  if (buffer.length === 0) return;
  const body = JSON.stringify({ vitals: buffer });
  buffer = [];

  if (navigator.sendBeacon) {
    const blob = new Blob([body], { type: 'application/json' });
    navigator.sendBeacon(ENDPOINT, blob);
    return;
  }

  // Fallback: keepalive lets the request outlive the page.
  void fetch(ENDPOINT, {
    method: 'POST',
    body,
    keepalive: true,
    headers: { 'Content-Type': 'application/json' },
  });
}

function flushWhenHidden(): void {
  if (document.visibilityState === 'hidden') flush();
}

export function startReporting(): void {
  onCLS(record);
  onINP(record);
  onLCP(record);
  onFCP(record);
  onTTFB(record);

  document.addEventListener('visibilitychange', flushWhenHidden);
  window.addEventListener('pagehide', flush);
}
import { useEffect, useRef } from 'react';
import { startReporting } from './reportWebVitals';
export function useWebVitals(): void {
const didInit = useRef(false);
useEffect(() => {
// Guard against React 18 Strict Mode's double effect invocation.
if (didInit.current) return;
didInit.current = true;
startReporting();
}, []);
}class WebVitalsController < ApplicationController
skip_before_action :verify_authenticity_token, only: :create
MAX_BATCH = 25
RATINGS = %w[good needs-improvement poor].freeze
def create
vitals = Array(params.dig(:vitals)).first(MAX_BATCH)
rows = vitals.filter_map do |v|
next unless RATINGS.include?(v[:rating])
{
metric_id: v[:id],
name: v[:name],
value: v[:value].to_f,
rating: v[:rating],
navigation_type: v[:navigationType],
path: v[:path],
user_agent: request.user_agent,
recorded_at: Time.current
}
end
WebVital.insert_all(rows) if rows.any?
head :no_content
end
endThis snippet shows how real-user performance metrics (Core Web Vitals) are captured in a React app and shipped reliably to a backend collector. The pattern matters because synthetic lab tests miss the long tail of real devices and networks; sending Web Vitals from actual sessions gives a true distribution of LCP, CLS, INP, FCP, and TTFB.
In reportWebVitals.ts, the web-vitals library callbacks are wrapped so each metric is normalized into a flat VitalPayload with a stable id, the metric name, its value, and a coarse rating. A key detail is that the reporter is buffered rather than firing a request per metric: metrics arrive at different times during a page's life, so flush() batches whatever has accumulated. Sending happens via navigator.sendBeacon, which queues the request in the browser's own queue and survives page unload — a plain fetch would be cancelled when the user navigates away, silently dropping the most important terminal metrics like CLS and INP. A fetch fallback with keepalive covers browsers without beacon support.
The flushWhenHidden wiring listens for visibilitychange and pagehide, the only reliable signals that a session is ending on mobile. Flushing on hidden rather than beforeunload is deliberate, since beforeunload is unreliable on iOS.
In useWebVitals.ts, a custom hook adapts the reporter to React's lifecycle. It runs once via useEffect with an empty dependency array and a didInit ref guard, because React 18 Strict Mode intentionally double-invokes effects in development; without the guard, listeners and metric subscriptions would be registered twice.
The WebVitalsController in Rails receives the batch, treats each entry as append-only telemetry, and uses insert_all for a single bulk write instead of N inserts. It responds 204 No Content because a beacon ignores the response body anyway, and it defensively caps the batch size to avoid a malicious or buggy client flooding the table. rating is validated against the known enum so bad data never reaches aggregation. Together these files form a compact, resilient Real User Monitoring pipeline where the browser's own delivery guarantees carry the data across the fragile moment of page teardown.
Related snips
package api

import (
  "net/http"
  "runtime/debug"
)
Expose build metadata for debugging deploys
require "csv"

class PeopleCsvStream
  include Enumerable

  HEADERS = %w[id full_name email signed_up_at plan].freeze
Resilient CSV Export as a Streamed Response
Rails.application.configure do
  config.after_initialize do
    Bullet.enable = true
    Bullet.alert = false
    Bullet.bullet_logger = true
    Bullet.console = true
N+1 query detection with Bullet gem
use tracing::{info, instrument};

#[instrument]
fn process_request(user_id: u64) {
    info!(user_id, "Processing request");
    // Work happens here
tracing for structured logging and distributed tracing
json.array! @posts do |post|
  json.cache! ['v1', post], expires_in: 1.hour do
    json.id post.id
    json.title post.title
    json.excerpt post.excerpt
    json.published_at post.published_at
Fragment caching for expensive JSON serialization
import axios, { AxiosError } from 'axios'
import { v4 as uuidv4 } from 'uuid'

const api = axios.create({
  baseURL: import.meta.env.VITE_API_URL || 'http://localhost:3000/api/v1',
  timeout: 15000,
Axios API client with interceptors
Share this code
Here's the card — post it anywhere.