python
34 lines · 1 tab
Priya Sharma
Jan 2026
1 tab
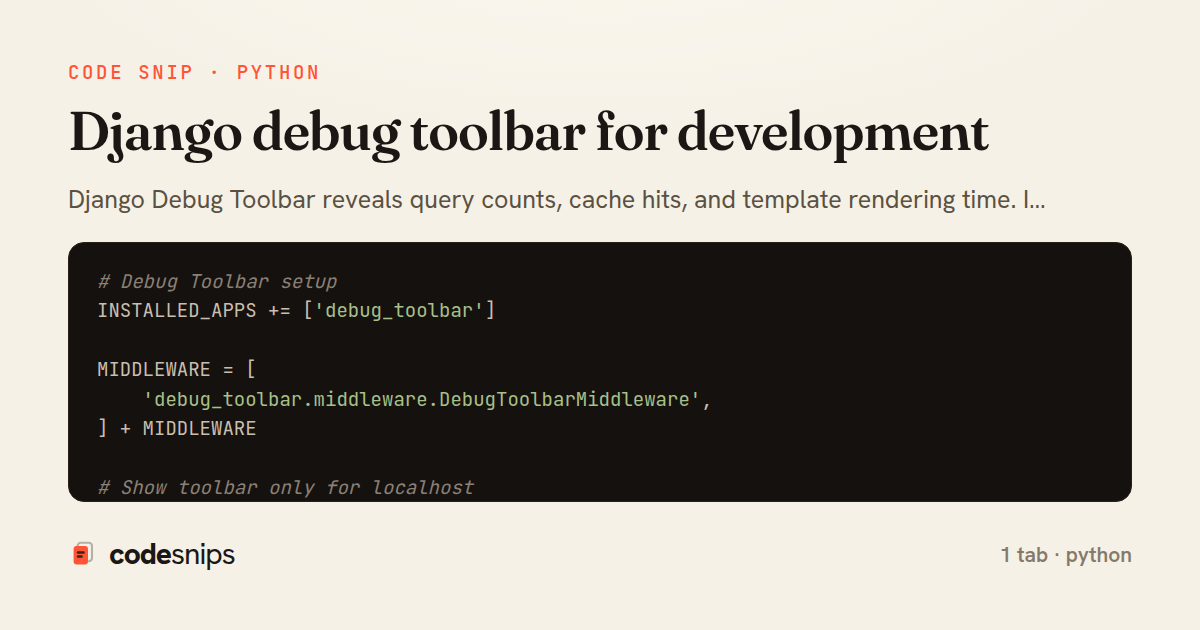
# Debug Toolbar setup
INSTALLED_APPS += ['debug_toolbar']

MIDDLEWARE = [
    'debug_toolbar.middleware.DebugToolbarMiddleware',
] + MIDDLEWARE

# Show toolbar only for localhost
INTERNAL_IPS = ['127.0.0.1', '::1']

# Custom callback for showing toolbar
def show_toolbar(request):
    return DEBUG and request.META.get('REMOTE_ADDR') in INTERNAL_IPS

DEBUG_TOOLBAR_CONFIG = {
    'SHOW_TOOLBAR_CALLBACK': show_toolbar,
    'SHOW_TEMPLATE_CONTEXT': True,
}

DEBUG_TOOLBAR_PANELS = [
    'debug_toolbar.panels.versions.VersionsPanel',
    'debug_toolbar.panels.timer.TimerPanel',
    'debug_toolbar.panels.settings.SettingsPanel',
    'debug_toolbar.panels.headers.HeadersPanel',
    'debug_toolbar.panels.request.RequestPanel',
    'debug_toolbar.panels.sql.SQLPanel',
    'debug_toolbar.panels.staticfiles.StaticFilesPanel',
    'debug_toolbar.panels.templates.TemplatesPanel',
    'debug_toolbar.panels.cache.CachePanel',
    'debug_toolbar.panels.signals.SignalsPanel',
    'debug_toolbar.panels.logging.LoggingPanel',
    'debug_toolbar.panels.redirects.RedirectsPanel',
    'debug_toolbar.panels.profiling.ProfilingPanel',
]
1 file · python
Explain with highlit
Django Debug Toolbar reveals query counts, cache hits, and template rendering time. I add it only in development settings. The toolbar shows all SQL queries which helps identify N+1 problems. I use the profiler panel to find slow code. The cache panel shows hit rates. For AJAX requests, I enable SHOW_TOOLBAR_CALLBACK to display toolbar selectively. I avoid running it in production—the performance overhead is significant. This tool is essential for Django performance optimization during development.
Related snips
python
import os
import stat

for root, _dirs, files in os.walk('/etc'):
    for name in files:
        path = os.path.join(root, name)
Python security audit script for exposed risky filesystem state
python
auditing
host-security
by Kai Nakamura
1 tab
python
class Product(models.Model):
    name = models.CharField(max_length=200)
    slug = models.SlugField(blank=True)
    price = models.DecimalField(max_digits=10, decimal_places=2)
    cost = models.DecimalField(max_digits=10, decimal_places=2)
    margin = models.DecimalField(max_digits=5, decimal_places=2, blank=True)
Django model signals vs overriding save
django
python
models
by Priya Sharma
2 tabs
ruby
require "csv"

class PeopleCsvStream
  include Enumerable

  HEADERS = %w[id full_name email signed_up_at plan].freeze
Resilient CSV Export as a Streamed Response
rails
performance
streaming
by codesnips
3 tabs
ruby
Rails.application.configure do
  config.after_initialize do
    Bullet.enable = true
    Bullet.alert = false
    Bullet.bullet_logger = true
    Bullet.console = true
N+1 query detection with Bullet gem
rails
performance
activerecord
by Alex Kumar
2 tabs
python
from django.urls import path
from . import views

app_name = 'blog'

urlpatterns = [
Django URL namespacing and reverse lookups
django
python
urls
by Priya Sharma
3 tabs
ruby
json.array! @posts do |post|
  json.cache! ['v1', post], expires_in: 1.hour do
    json.id post.id
    json.title post.title
    json.excerpt post.excerpt
    json.published_at post.published_at
Fragment caching for expensive JSON serialization
rails
caching
performance
by Alex Kumar
1 tab
Share this code
Here's the card — post it anywhere.