package observability

import (
  "time"

  "go.uber.org/zap"
  "go.uber.org/zap/zapcore"
)

func NewSampledLogger(base zapcore.Core) *zap.Logger {
  sampled := zapcore.NewSamplerWithOptions(base, time.Second, 100, 10)
  return zap.New(sampled)
}
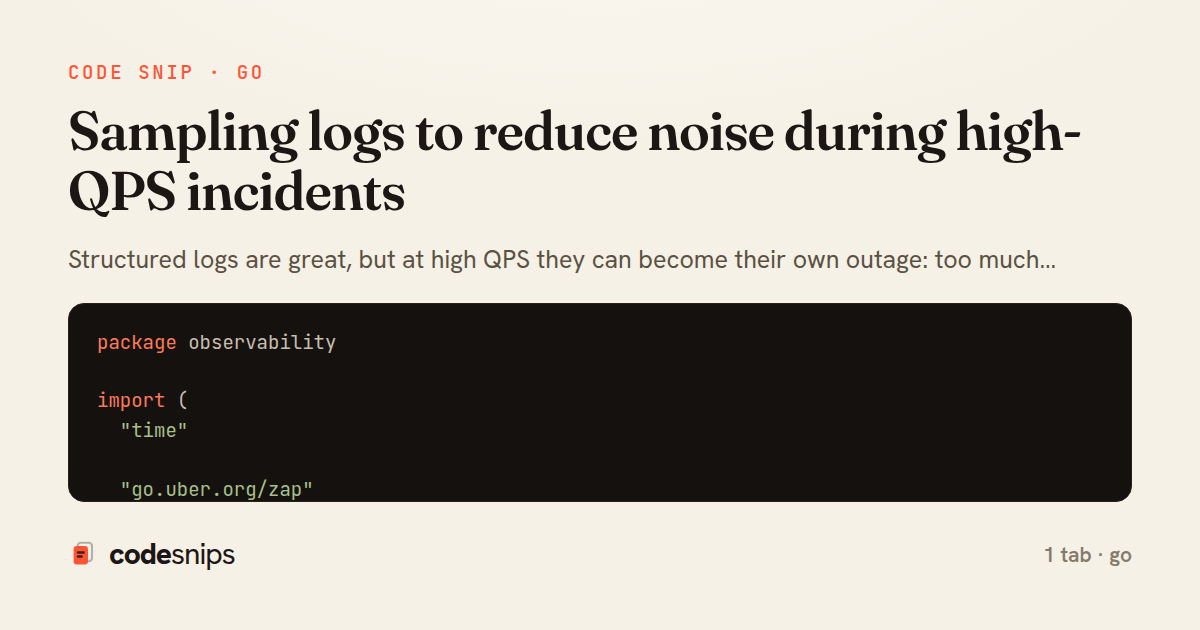
Structured logs are great, but at high QPS they can become their own outage: too much IO, too much storage, and noisy dashboards. zap includes a sampler that allows you to keep early logs and then sample at a fixed rate. I like this for “successful request” logs while keeping errors unsampled. The important point is to be intentional: sampling should never hide rare failures, so error logs should stay at full fidelity, and metrics should be your primary signal for latency and error rate. The code below builds a core logger and wraps it with zapcore.NewSamplerWithOptions. In production, I tune the sampling rates based on real throughput and I document them so operators understand why they see fewer log lines during traffic spikes.
Related snips
package api

import (
  "net/http"
  "runtime/debug"
)
Expose build metadata for debugging deploys
package dbutil

import (
  "context"

  "github.com/jackc/pgconn"
Retry Postgres serialization failures with bounded attempts
require "csv"

class PeopleCsvStream
  include Enumerable

  HEADERS = %w[id full_name email signed_up_at plan].freeze
Resilient CSV Export as a Streamed Response
Rails.application.configure do
  config.after_initialize do
    Bullet.enable = true
    Bullet.alert = false
    Bullet.bullet_logger = true
    Bullet.console = true
N+1 query detection with Bullet gem
use tracing::{info, instrument};

#[instrument]
fn process_request(user_id: u64) {
    info!(user_id, "Processing request");
    // Work happens here
tracing for structured logging and distributed tracing
json.array! @posts do |post|
  json.cache! ['v1', post], expires_in: 1.hour do
    json.id post.id
    json.title post.title
    json.excerpt post.excerpt
    json.published_at post.published_at
Fragment caching for expensive JSON serialization
Share this code
Here's the card — post it anywhere.